A DETECTOR FOR GRAVITATIONAL WAVES
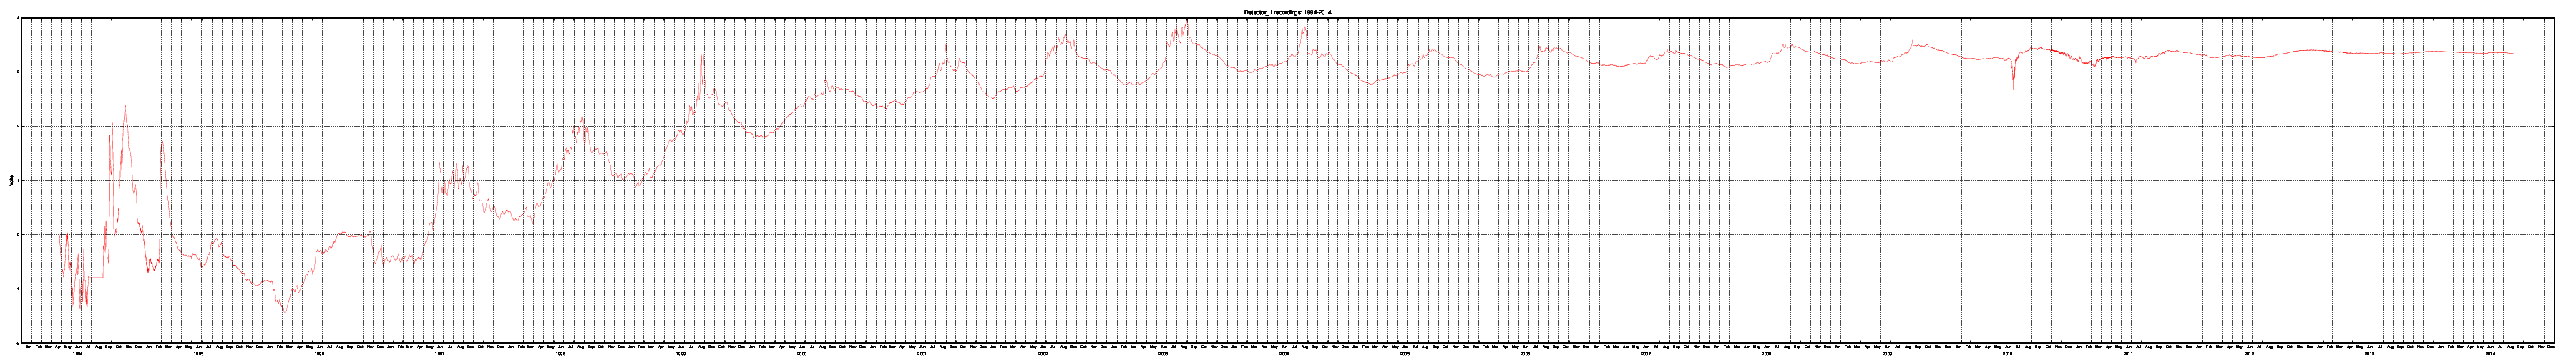
The Detector 1 is continuously operating since 26 April 1994. The analysis the graphs performed with the data carried out these years have allowed discovering a series of completely new phenomena occurring in the Universe, among which, the existence of particular extra-massive Multiple Nucleus Quasars that seem to affect its operating.
Timetable of the main events: ![]() PDF file (28 kb);
PDF file (28 kb); ![]() PDF file (28 kb)
PDF file (28 kb)
Poster with, figures, graphs, main events, etc... ![]() PDF file (307 kb);
PDF file (307 kb); ![]() PDF file (304 kb)
PDF file (304 kb)
Recordings & Graphs (Last updated: April 11, 2025)
Rome, 7 November 2021.
In October, the fans in the external thermostatic enclosure of Detectors 2 and 3 were replaced. The fans
had been running since early 2000 and had become too noisy. This replacement resulted in some signal drifts due to variations,
even if minimal, in the temperature of the sensors as the internal thermostatic enclosure were not sufficient
to compensate for the variations in ambient temperature.
In addition, for Detector 2 it was necessary more time in order to fix the troubles of the temperature regulation. Rome, 1 August 2021.
On 16/06/2021, the Peltier cell cooling fan in the external thermostatic enclosure of the D3b detector failed and the
internal thermostatic enclosure was unable to compensate the rise of the sensor temperature. The fan was replaced on 20/06/2021
and, after a few days, the detector started working properly again.
Rome, 8 December 2020.
The temperature regulation of the external enclosure of the Detector 2 shows some troubles that will be fixed as soon as possible. Rome, 09 June 2020.
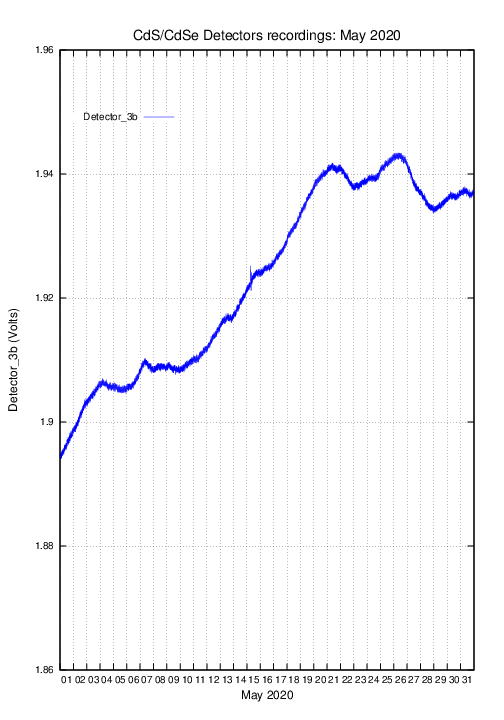
On May 2020 a series of nuclei collapses can be noticed quite clearly. The distance between peaks is approx. 6.5 days, so that
the width of wave is w=(6.5/11.5)*9.5=5.4 and redshift is z=w-1=5.4-1=4.4. The distance from us of the collapses results as:
r0=RU*z/(z+1)=RU*4.4/5.4, that is approx. 80 percent of visible Universe radius RU.
For the formulas used in this calculations, please see Part 7: Redshift. Rome, 17 September 2018.
The small daily oscillations present on the detector D2b signal, from the end of July to 14 of August, are due to
the high ambient temperaturre which brought the external thermostatic enclosure to work at the limit of its possibilities. Rome, 11 March 2018.
The detector D2b that went out of service in January 2015 was re-activated in September 2015. After a formatting period
of about 6-8 months, the detector has resumed its operation very slowly, increasing its sensitivity over time.
After 2 years of operation, we can state that it has reached its equilibrium and the trend is quite in line with
that of the Detector 3b. Rome, 1 December 2017.
On September, October and November we witness a long series of gravitational collapses that took place far away from us.
All collapses have a very high redshift (z>10) and the waves are superimposed and somewhat confused, as shown in the high
resolution images. Rome, 10 September 2017.
The small oscillations present on the Detector_3 signal from 6 to 11 August are due to the out-of-service of the external
thermostatic enclosure due to excessive room temperature. Rome, 04 May 2017.
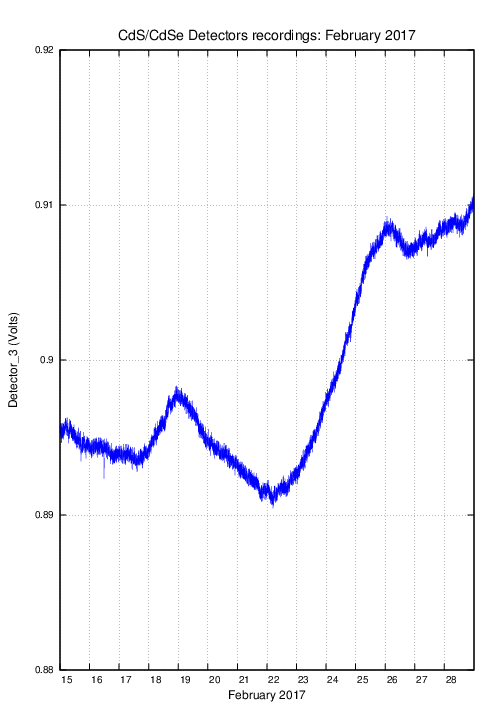
On February 2017 a new nucleus collapse has been detected quite clearly. The distance between peaks is 7.0 days, so that
the width of wave is w=(7.0/11.5)*9.5=5.8 and redshift is z=w-1=5.8-1=4.8. The distance from us of the collapse results as:
r0=RU*z/(z+1)=RU*4.8/5.8, that is approx. 83 percent of visible Universe radius RU.
For the formulas used in this calculations, please see Part 7: Redshift. Rome, 05 July 2016.
On June 2016 there have beeen three black-out on the grid. The last one, occurred on 20 June, lasted for four
days and put out of service the DAQ system. The detectors have not suffered significantly. Rome, 14 June 2016.
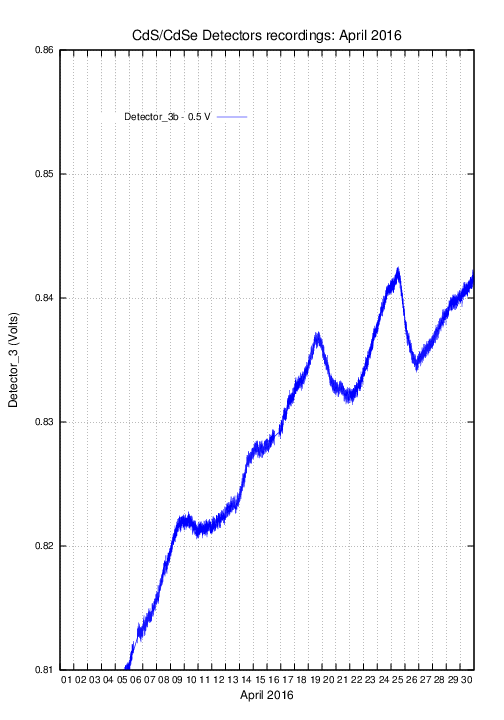
On April 2016 two new collapse of nuclei have been detected. The distance between peaks is approx 6 days.
They could belong to the same MNQ whose one of the nucleus has collapsed last February.
The amplitude of the peaks is lower, in this case, due to the detector signal is increasing quickly in this period. Rome, 03 March 2016.
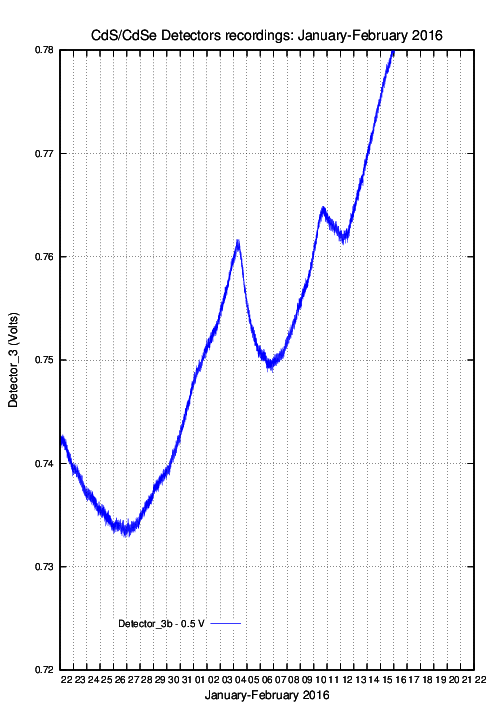
On February 2016 a new nucleus collapse has been detected very clearly. The distance between peaks is 6.5 days,
so that the width of wave is w=(6.5/11.5)*9.5=5.4 and redshift is z=w-1=5.4-1=4.4. The distance from us of the collapse
results as: r0=RU*z/(z+1)=RU*4.4/5.4, that is approx. 80 percent of visible Universe radius RU.
For the formulas used in this calculations, please see Part 7: Redshift. Rome, 17 March 2015.
On January 8, 2015, there was a black-out that lasted five days. The Detector 2 went off almost immediately
as the 12 years old batteries have not been able to feed it for such a long period.
The Detector 3, instead, whose batteries were replaced few years ago has been regularly feeded along with the
internal thermostatic enclosure. Rome, 20 March 2014.
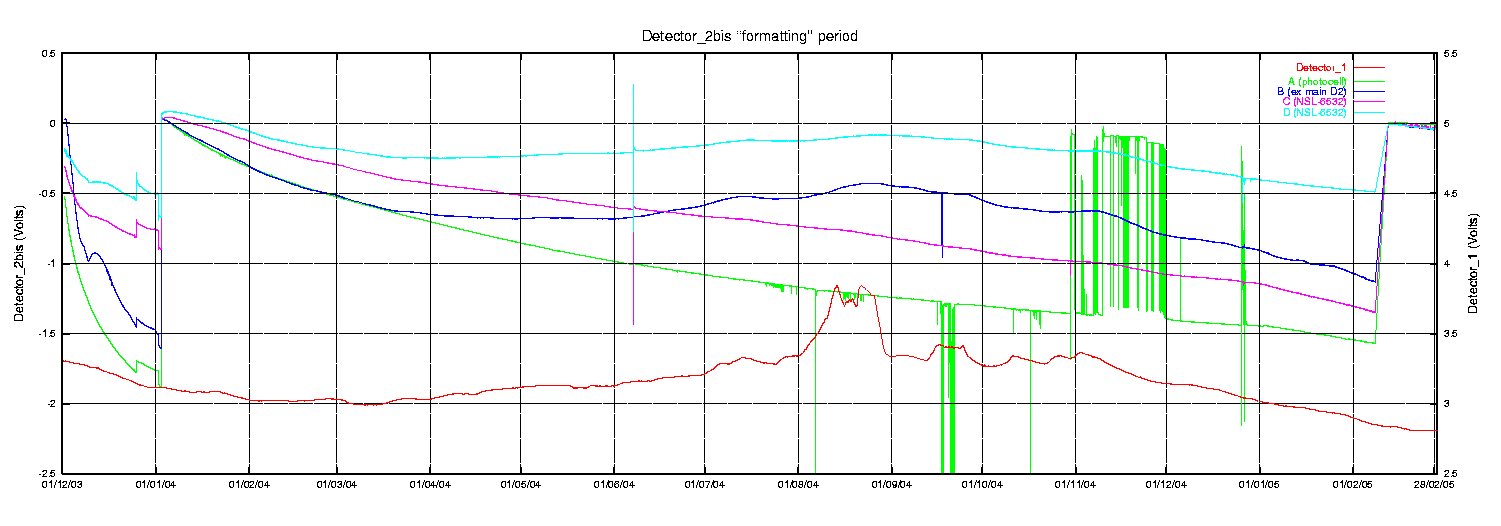
The formatting of the photoresistor D2b, which was disconnected for about an hour in December 2013, is continuing.
Superimposed on the signal of the detector there is an environmental noise of few milliVolts which will be eliminated
as soon as possible. Rome, 14 January 2014.
On December 7, 2013, the photoresistor D2b was disconnected for about an hour and then reconnected to the Wheatstone bridge.
Even the photoresistors D2c and D2d were reconnected to their respective Wheatstone bridges (they had been disconnected
on July 2007). The anode current of the display (light source) has been increased from 2.7 mA to 3.5 mA in order to reduce
the resistance of the photoresistor D2b to about 100 kOhms. Rome, 05 July 2013.
During the rise of signal which started on the beginning of March 2013, a new series of collapses that seens to belong to
the same Multiple Nucleus Quasar (MNQ) has been detecting. The distance (T) between the primary and the secondary peak is
estimated to be approx. 11-13 days. Therefore, the width of waves [w=(T/11.5)*9.5] is approx. 9-11 and redshift (z=w-1) of approx. 8-10.
The distance [r0=RU*z/(z+1)] from us of the supposed MNQ when collapsed was approx. 9/10 of
the visible Universe radius RU. Rome, 05 May 2013.
Since October 2012 to the present there has been a rather significant "gravitational activity " with several collapses of quasar nuclei. Rome, 09 July 2012.
On 15 through 17 of June 2012 the external thermostatic enclosure of Detector_1 has been replaced with a new one. Rome, 07 March 2012.
At beginning of January 2012 and for about two weeks Detector_2 and Detector_3 lost the external power supply (grid).
The batteries lost most of their charge and both detectors went down. After two months from the accident,
the Detector_2 is running more or less correctely while Detector_3 is still formatting. Rome, 04 February 2011.
Troubles of the external thermostatic enclosure of Detector_1 are still continuing. Very likley, the thermostatic
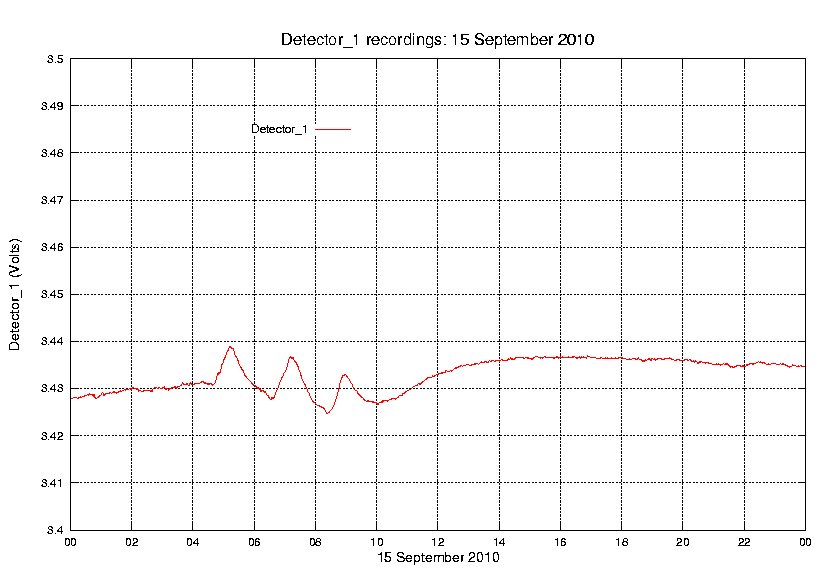
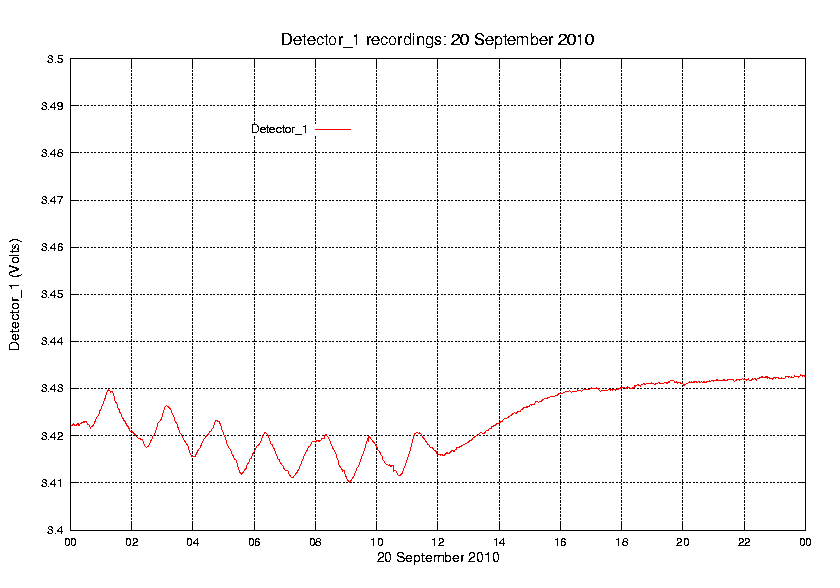
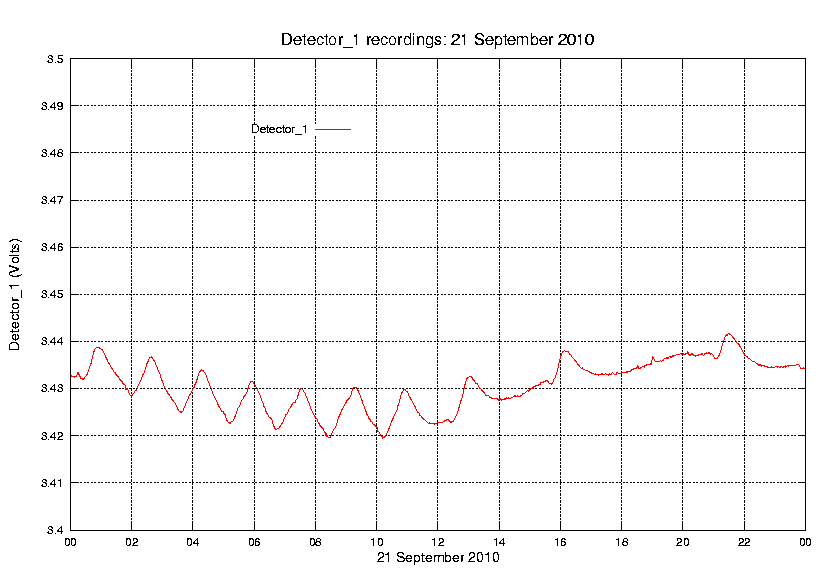
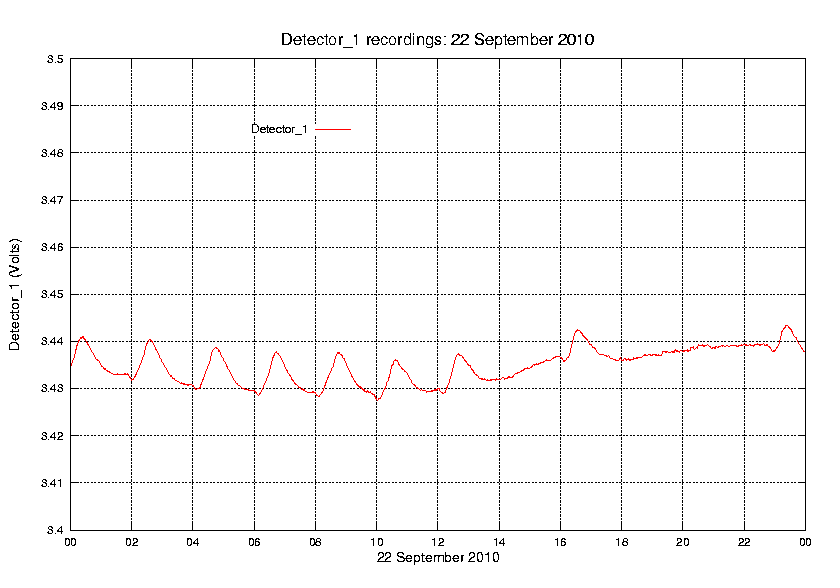
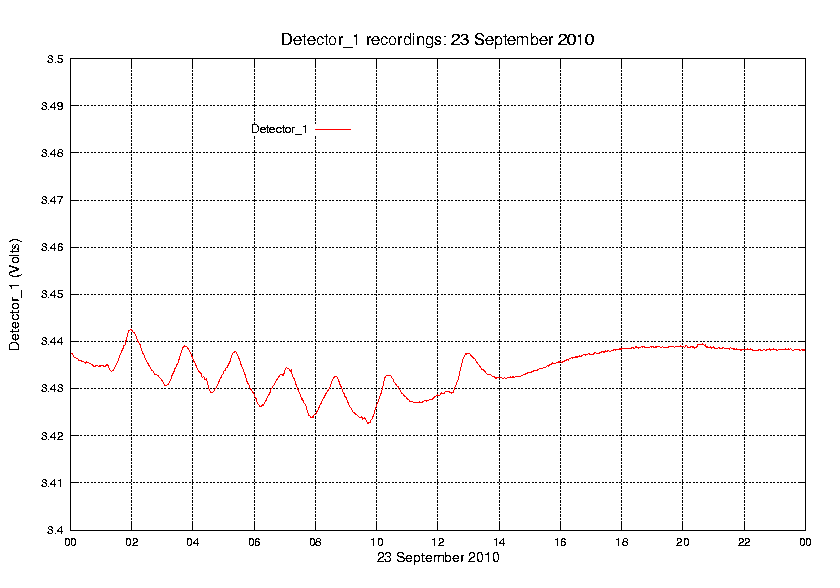
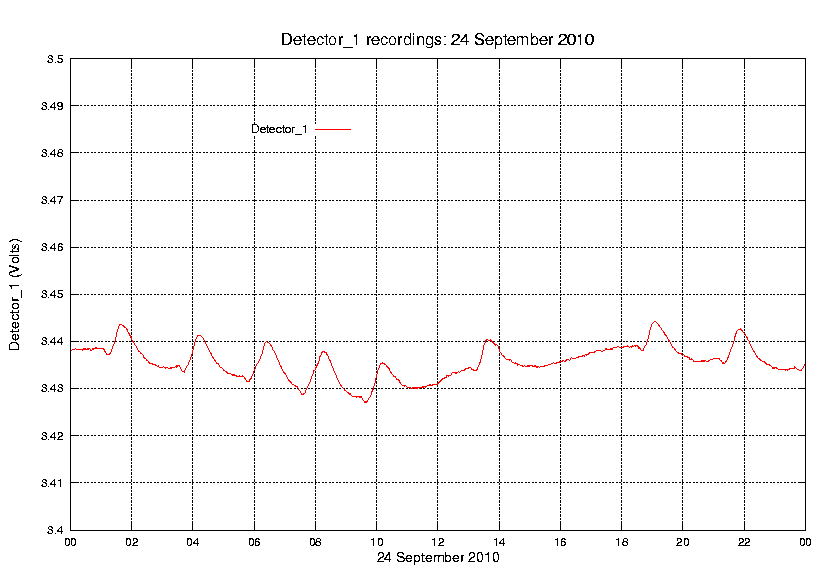
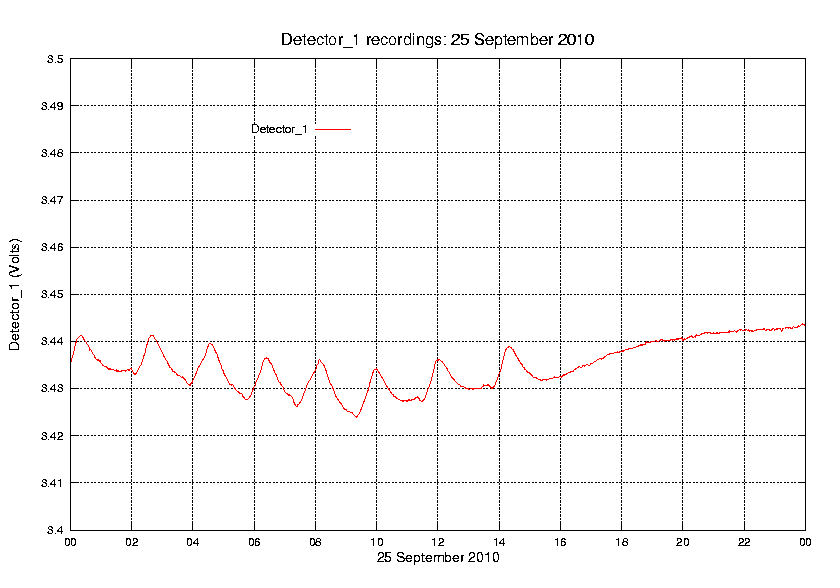
enclosure needs to be replaced. Rome, 17 October 2010. A series of peaks, similar to the ones of the
previous months, were detected on 15, 20,
21, 22, 23,
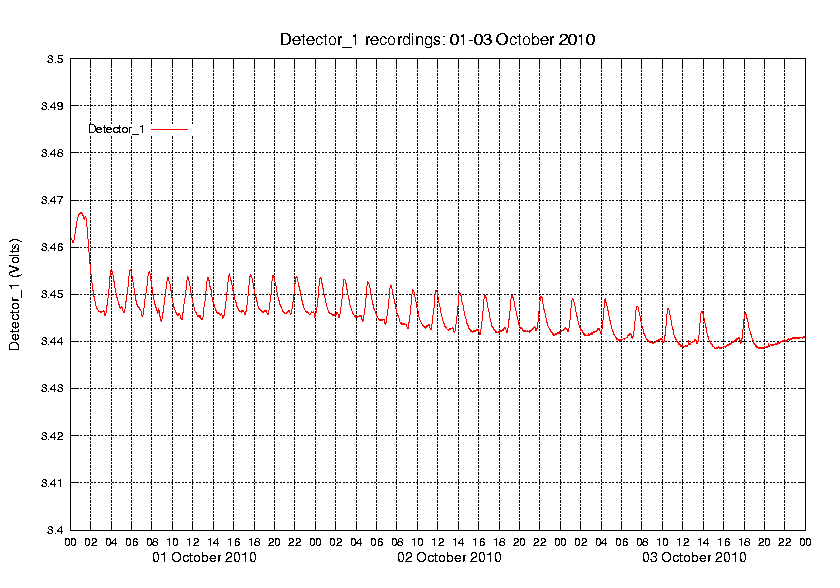
24 and 25 of September. A series of peaks lasting 3 days
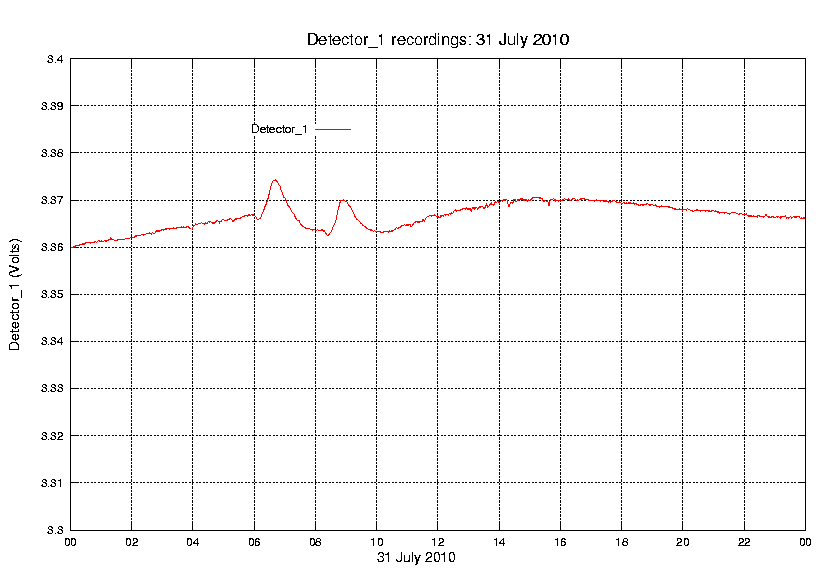
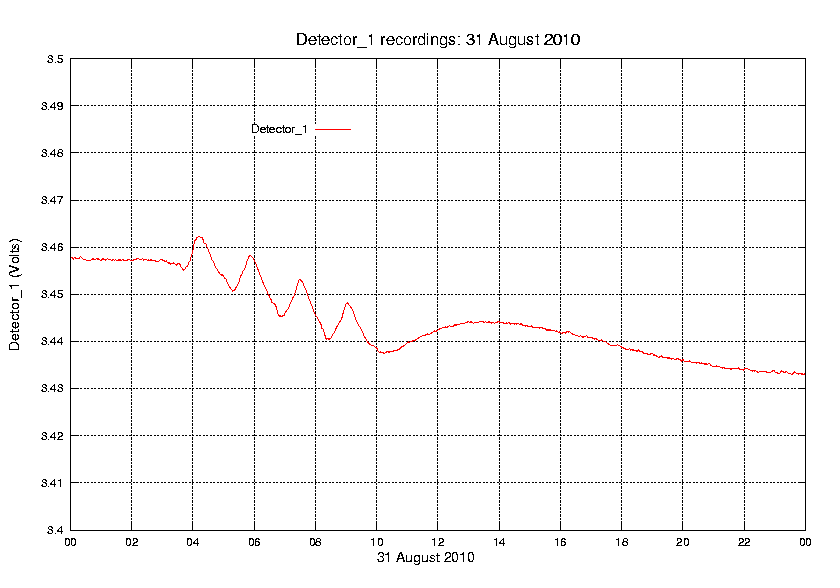
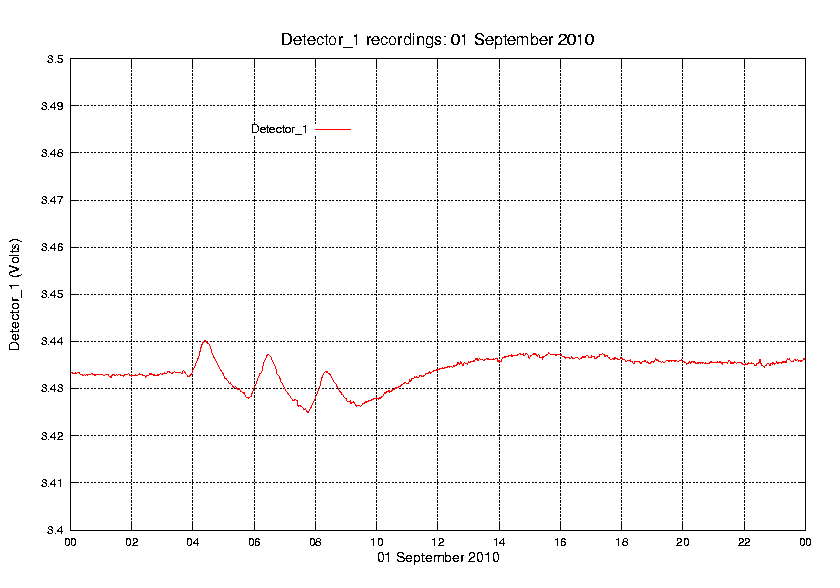
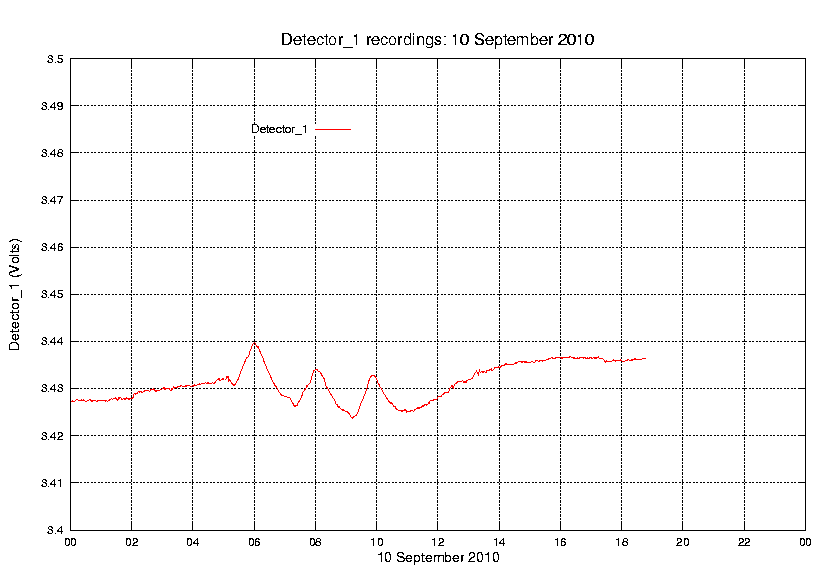
were detected on 01-03 of October 2010. Rome, 13 September 2010. More graphs, similar to the ones of the
previous months, were detected on 31 of July,
31 of August and 01,
02, 03,
10 of September 2010. Rome, 10 July 2010.
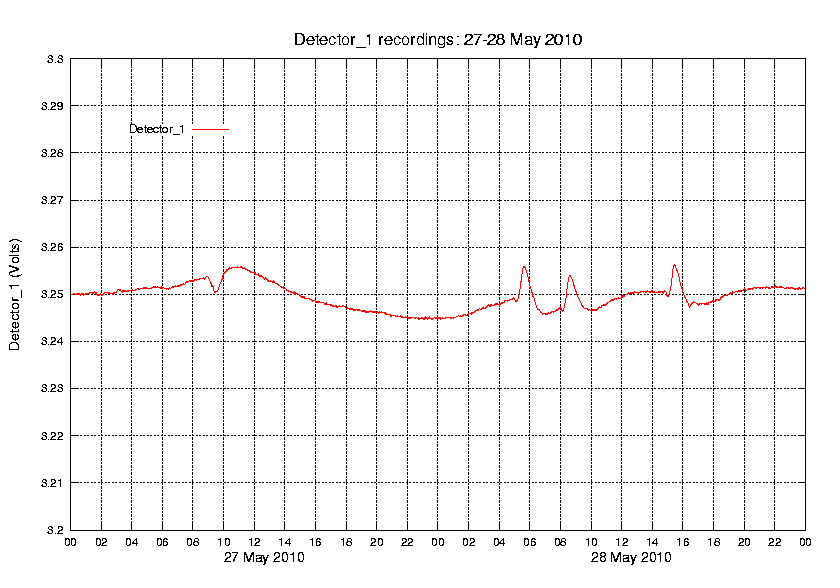
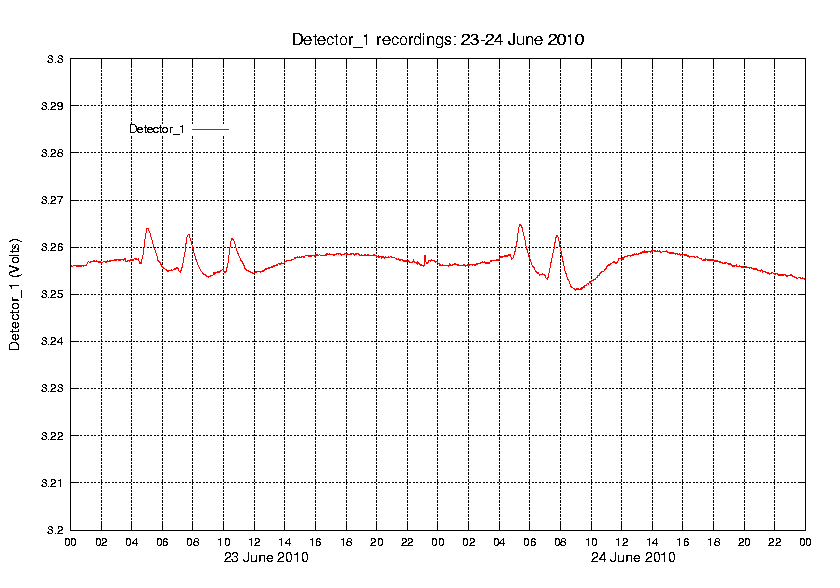
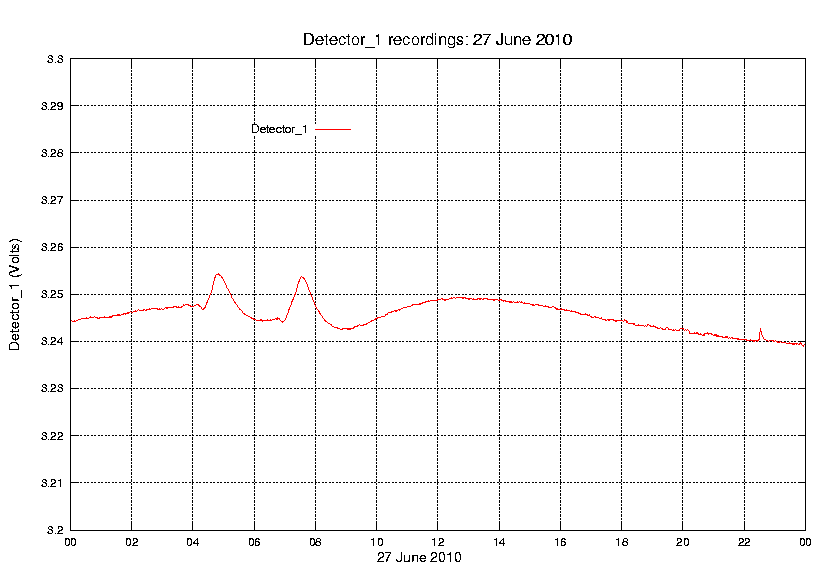
On 27-28 of May 2010 our detector started to record a new gravitational phenomenom.
Similar recording was observed on 21-22,
23-24 and 27 of June.
The shape of gravitational wave which lasts about 1 hour suggests to us that the phenomenon might concern the falling of stars on a
relatively "small" celestial object such as galactic nucleus (e.g. a very young quasar).
In fact, all the phenomenon starts with a small negative step of few millivolt (that is, the impact of the star with the surface of the
object). Following the impact, a sort of long period oscillating instability seems to be generated on the celestial object itself.
Very likely, the wave on 27 of May 2010 was generated by a more massive falling star. Rome, 03 May 2010.
On 11 April 2010 a lightning damaged the temperature-controlled enclosure of Detector_2. The enclosure was re-started on 24 April. Rome, 17 November 2009.
On September 2009 the anode current of the Detector_3 was reduced. The detector will take some months to stabilize. Rome, 13 May 2009.
Due to troubles on the DAQ systems, readings for Detector_2 and Detector_3 from 1st to 14th April were lost and readings
of Detector_1 from 21st to 29th of April were taken manually (one reading per day). Rome, 12 November 2008.
Graphs of other experimental CdS detectors were added. On June 2008, some readings were lost. Rome, 18 September 2007.
Readings for Detector_3b on July-August were taken manually due to troubles of the DAQ system. Rome, 23 June 2007.
Spikes on Detector_3b graphs on March through May are due to troubles of the multiplexer DAQ system. Rome, 07 September 2006.
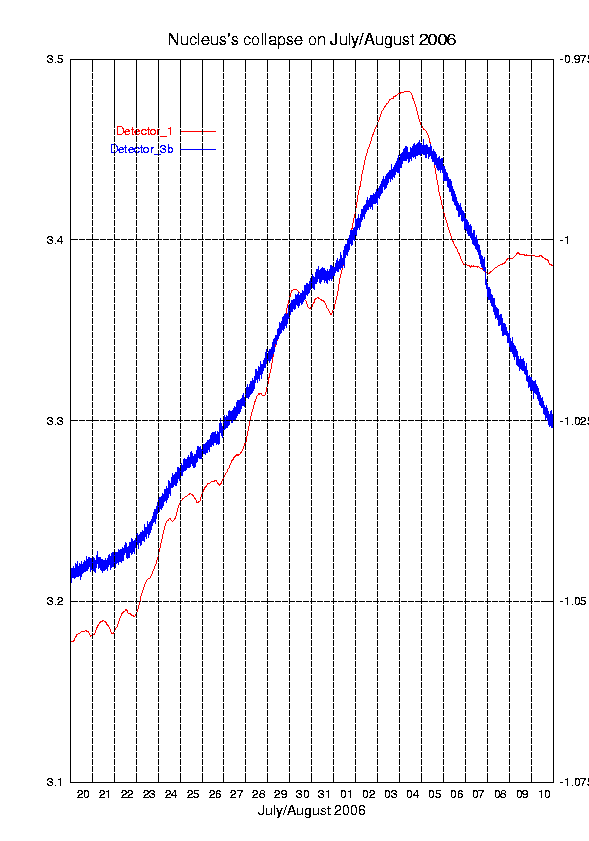
A new MNQ nucleus collapse has been detected (more clearly by the Detector_1 and less clearly by Detector_3b, ) between the
end of July and the beginning of August. The distance between peaks is approx. 5.5 days (z approx. 3.5).
Therefore, also this nucleus belong to the same MNQ whose general collapse started in the last winter. Rome, 11 June 2006.
The recording of the MNQ general collapse has been continuing, with the collapse of a new nucleus recorded at the end of May 2006. Rome, 14 May 2006.
In the first half of April 2006 a new nucleus collapses has been detected, that seems to belong to the same MNQ. Rome, 12 April 2006.
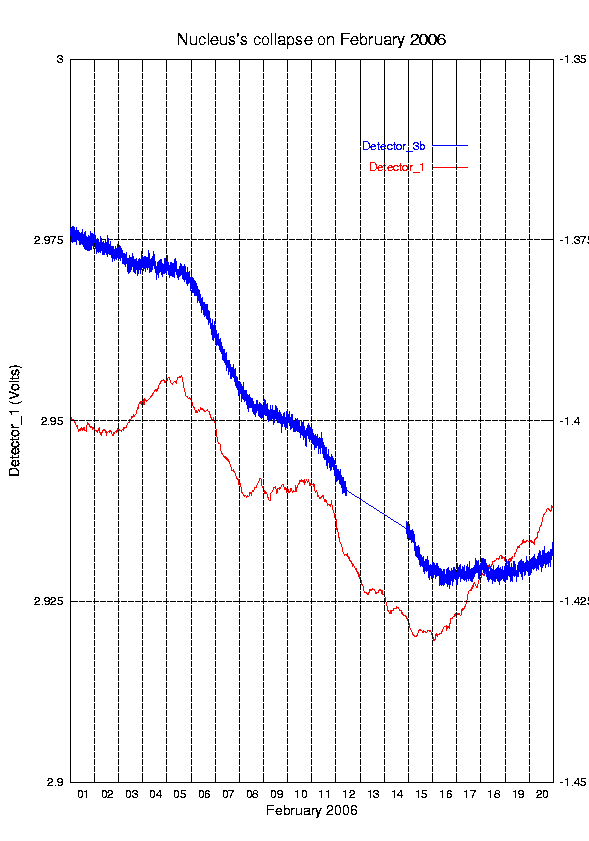
On the beginning of 2006 two new nucleus collapses has been detected.
Both collapses have the distance between peaks of approx. 5.5 days. Therefore, the width of wave is w=(5.5/11.5)*9.5=4.5 and redshift is z=w-1=3.5.
This collapsed nuclei belong to the same MNQ whose distance from us results as: Rome, 21 January 2006.
In December graphs we have also included the recording of Detector 3b but this detector is still recovering after
modifying the operating parameters carried out on last November (a few milli Volts fluctuations on the anodic voltage,
due to the temperature, was eliminated and the anodic current was increased from 3.87 mA to 4.23 mA in order
to improve its sensitivity). Rome, 10 December 2005.
In the last November, we modify some of the operating parameters of Detector 3. We restart publishing the graphs on January 2006. Rome, 7 September 2005.
After the failures occurred in July, Detector 3 is still recovering. Rome, 10 August 2005.
The collapse started on the end of June has a distance between peaks of approx. 10 days. Therefore, the width of wave
is w=(10/11.5)*9.5=8.3 and redshift z=w-1=7.3. So that, the distance of collapse results: Rome, 10 September 2004: On 23rd of August the data acquisition
system of Detector N. 1 failed and was out of service
until 1 September. Also the one-day manual readings were not available and the graph was completed with the help of
Detector N. 3 data. Rome, 19 April 2004: Data of beginning
of February have been restored, while some data of March were lost. Rome, 9 March 2004: Some troubles with
the Personal Computer caused the lost of some Detector N. 3 data of beginning of February.
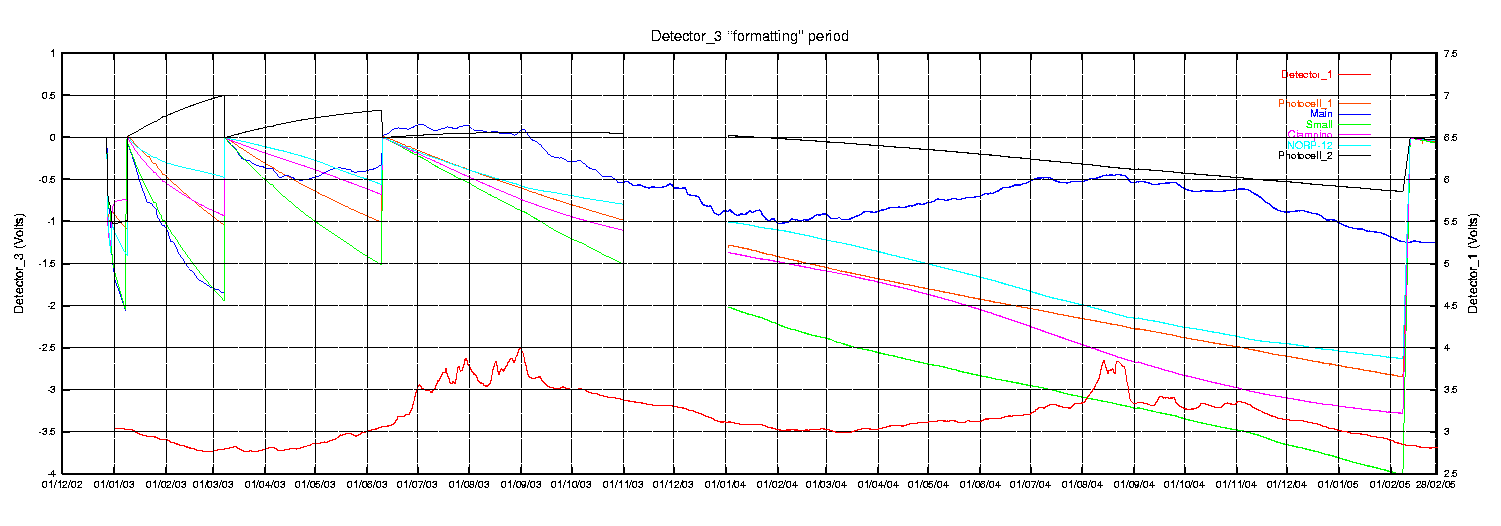
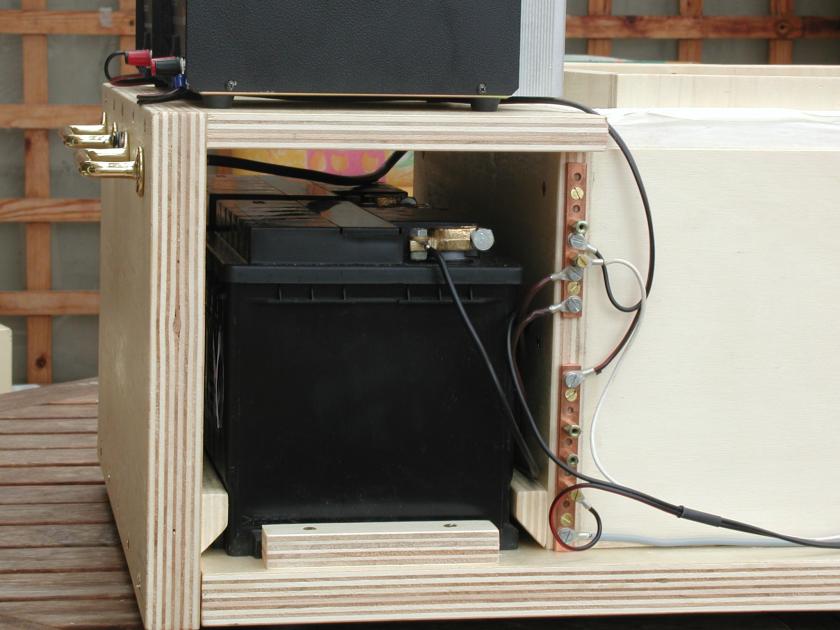
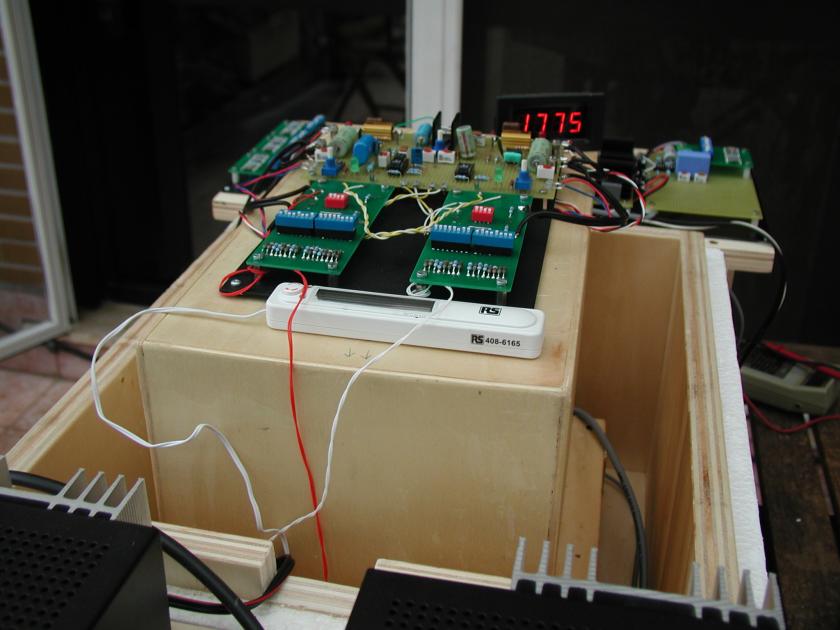
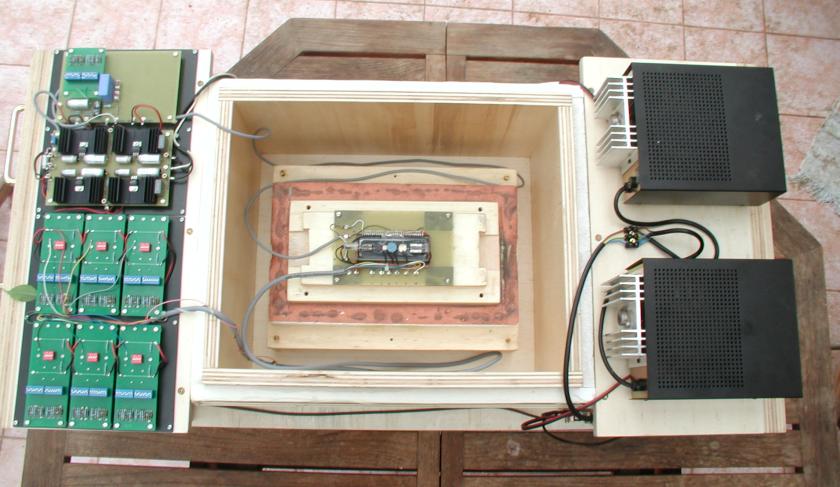
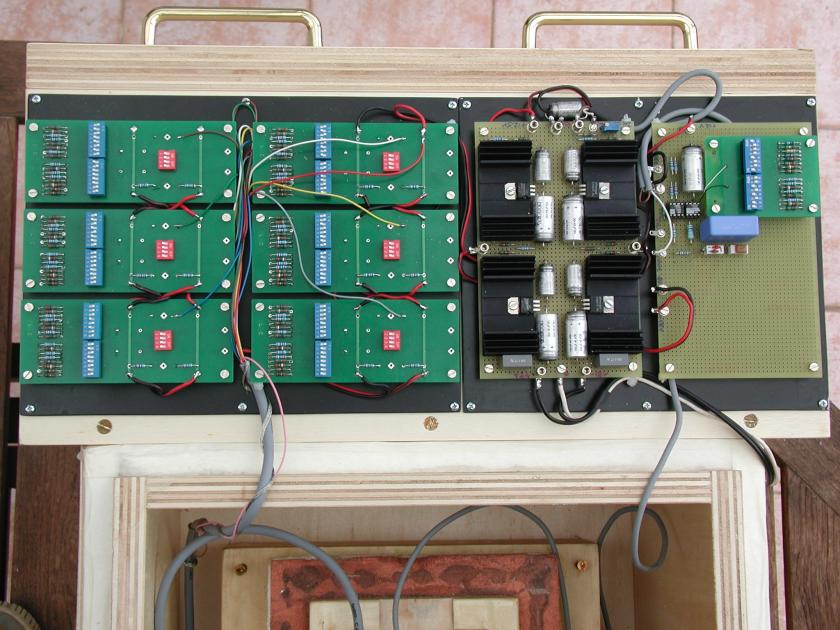
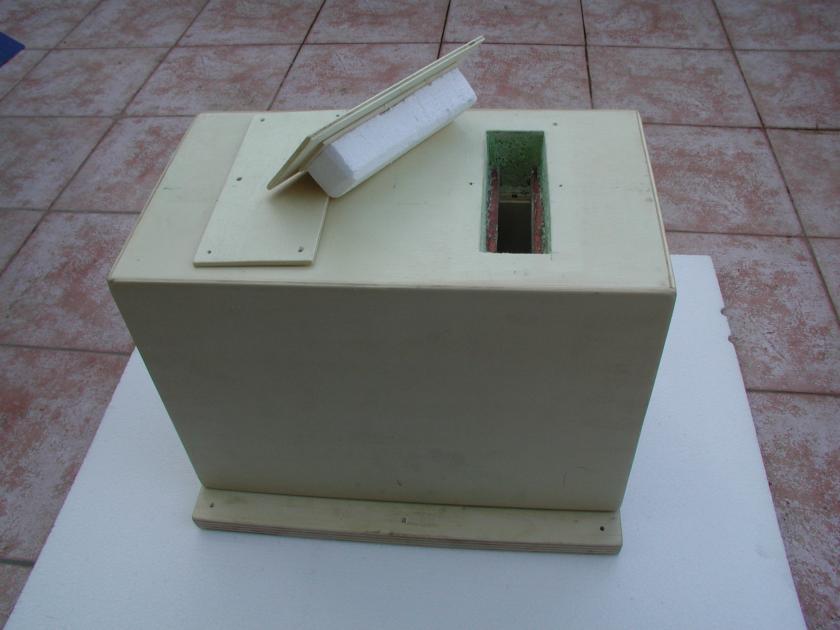
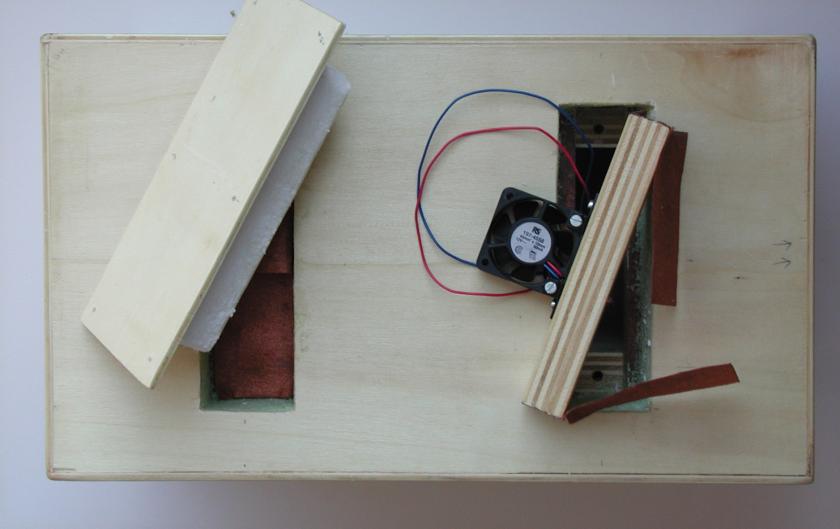
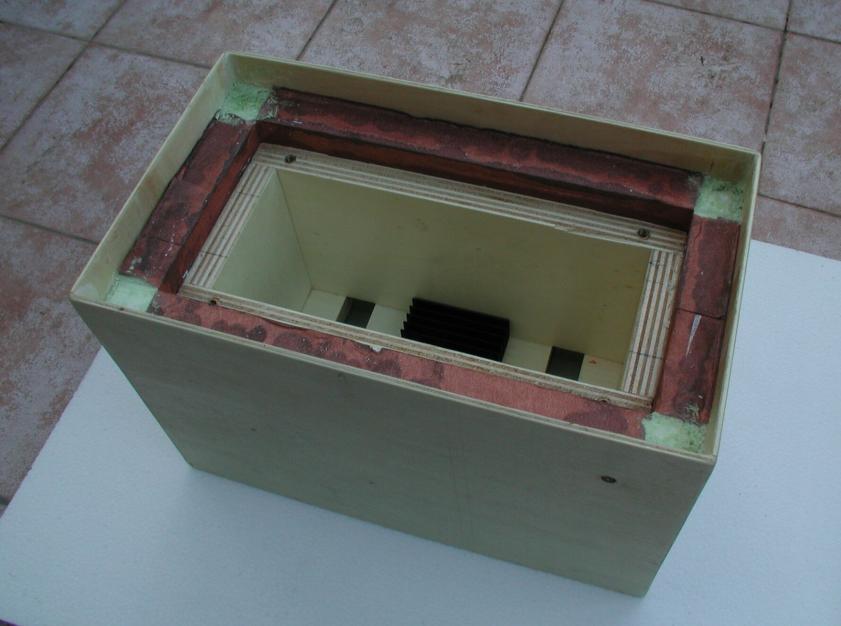
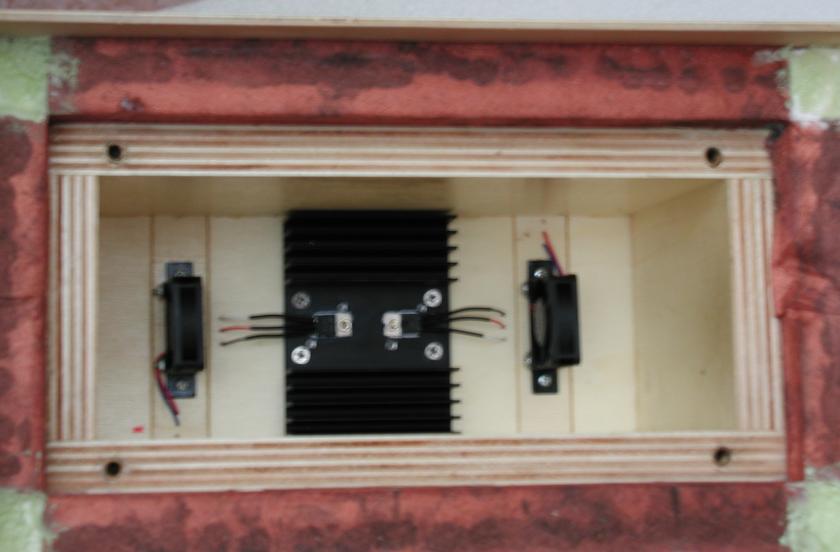
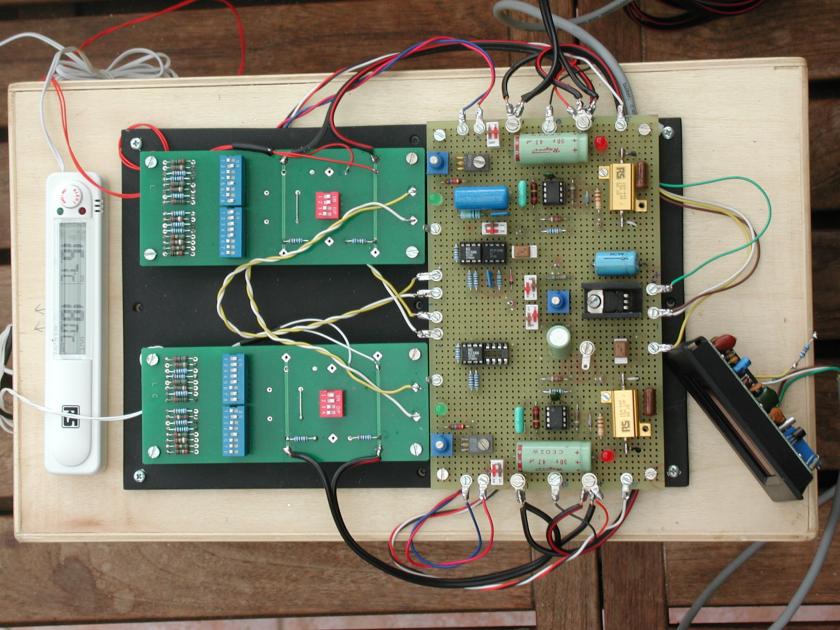
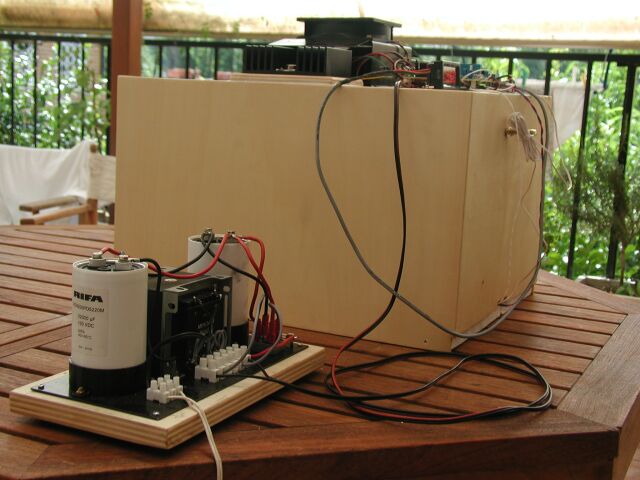
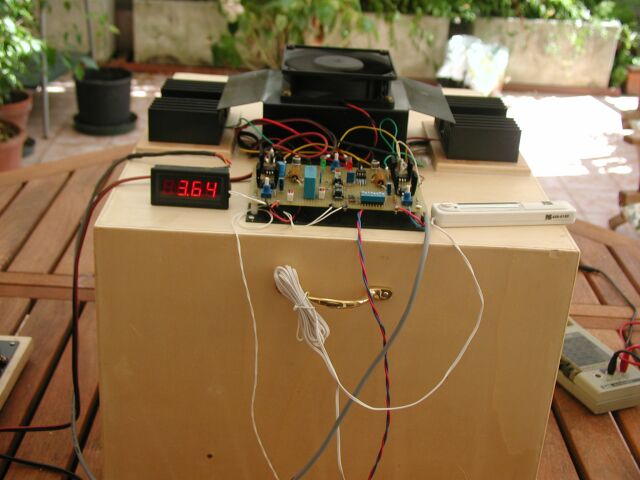
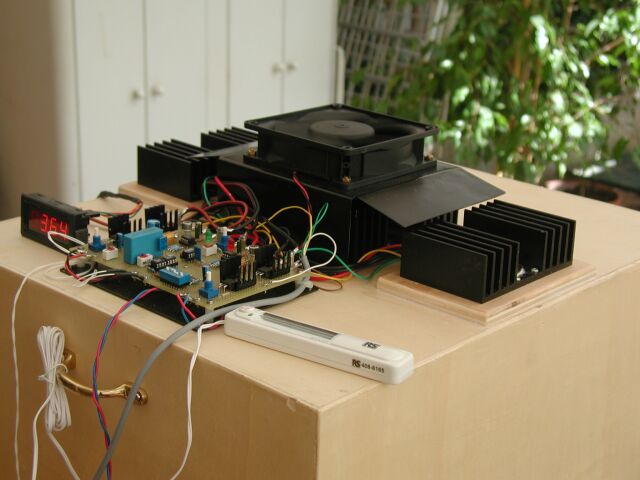
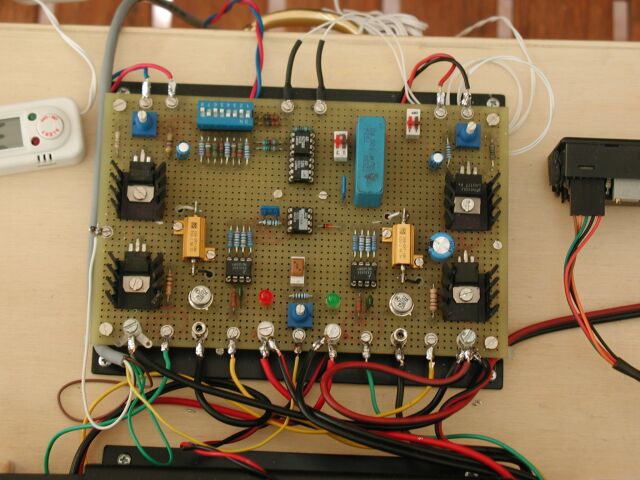
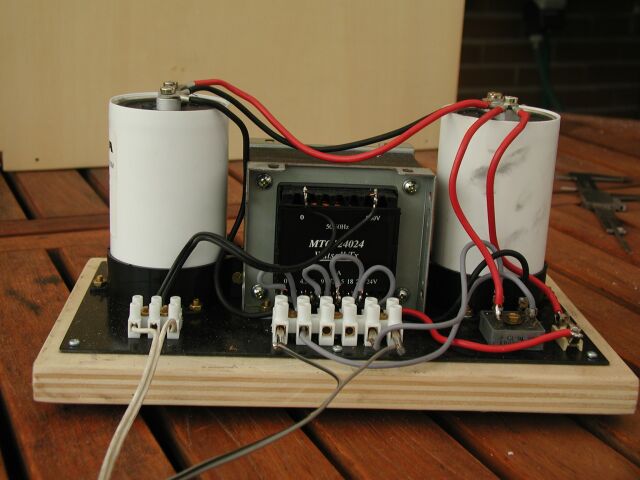
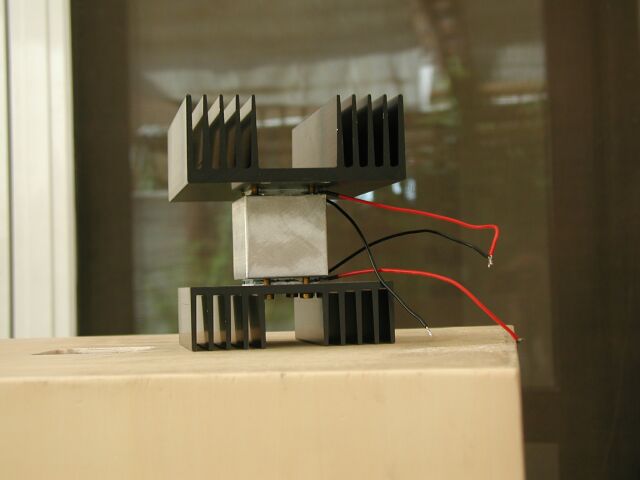
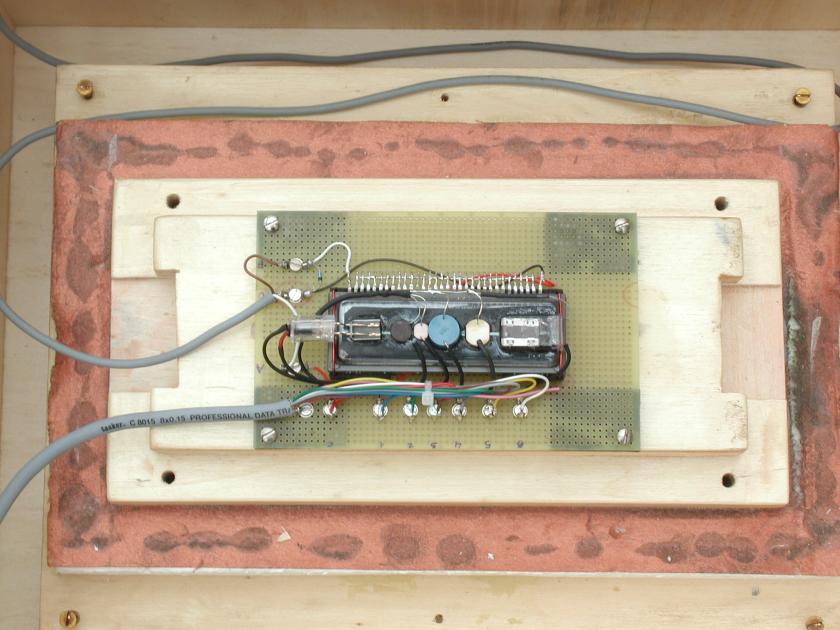
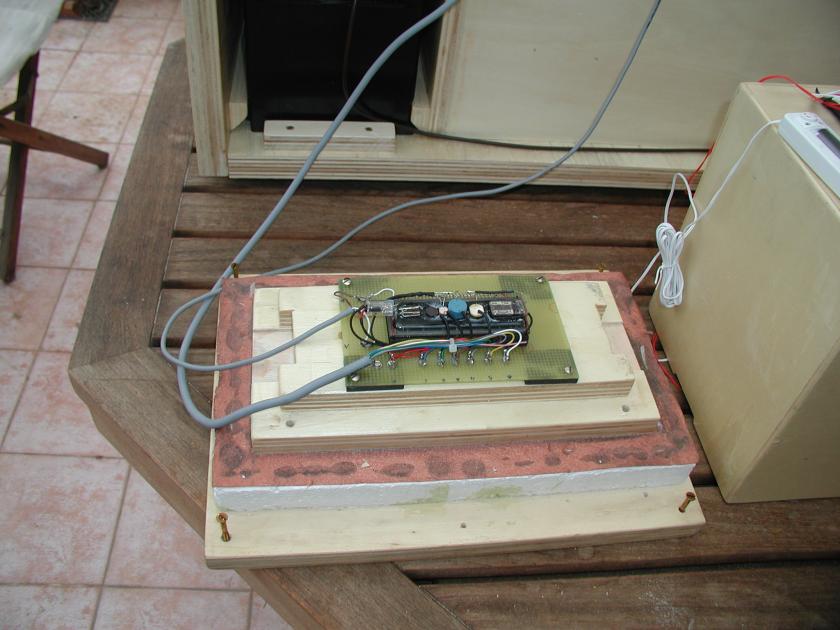
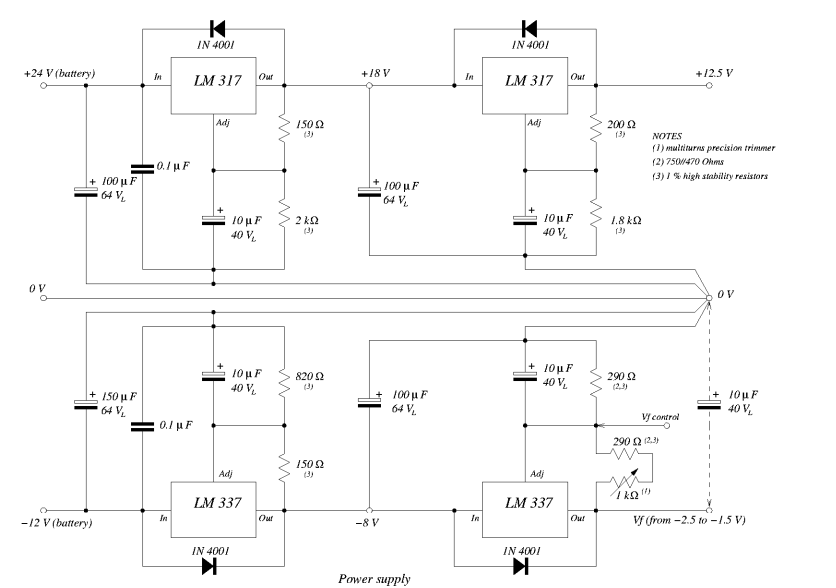
We are trying to recover them. Construction of the Detector The report describes the construction of the detector for Gravitational Waves that uses CdS photoresistors.
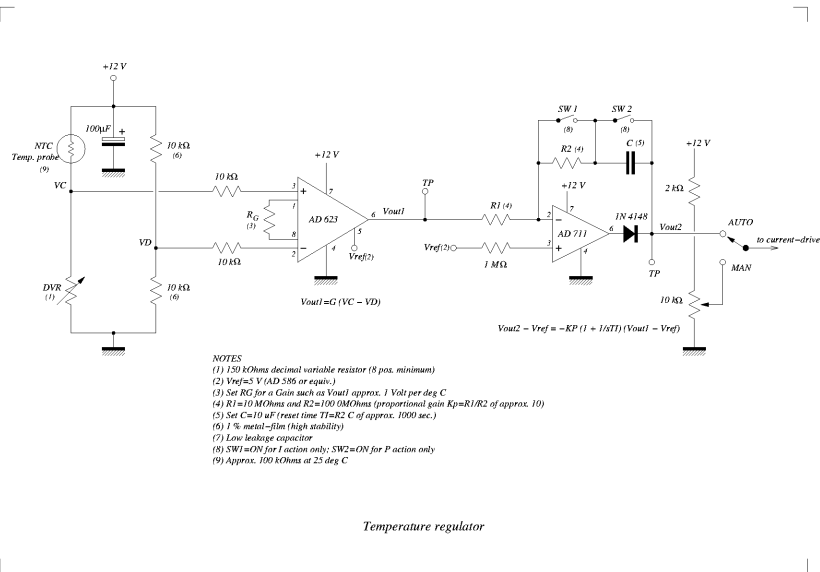
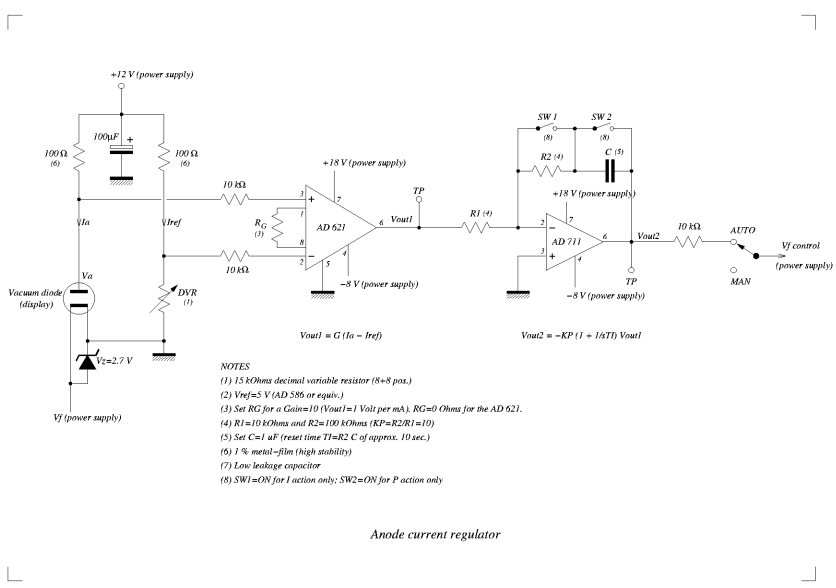
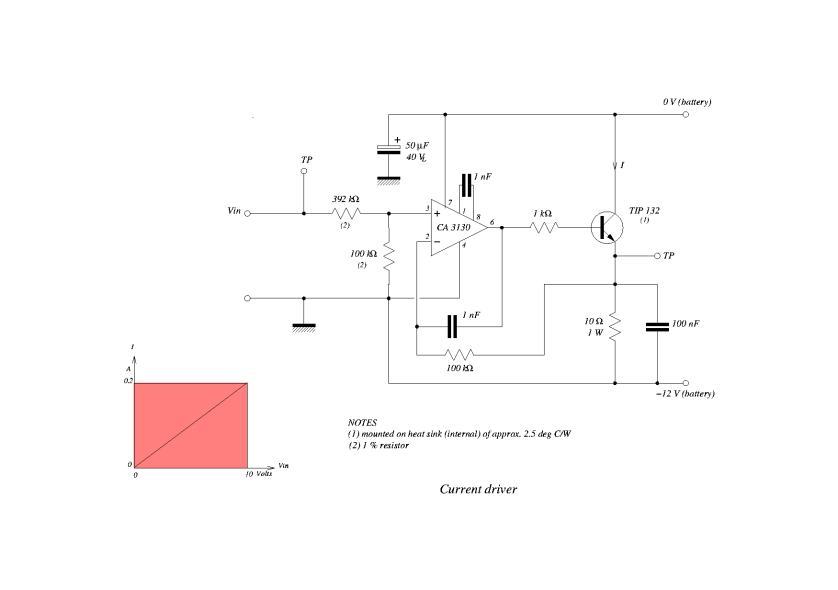
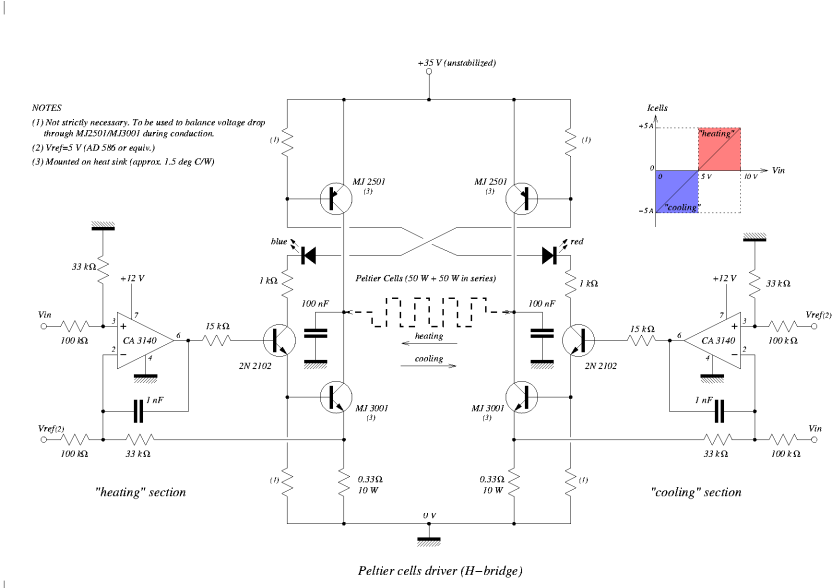
It gives informations for its construction as well as electrical diagrams for power supply, anode current regulator and
temperature regulators. Moreover, there are informations for set up and tuning the detector, which include also the initial
period we called "formatting" where, with passing the time, the detector becomes more and more sensitive
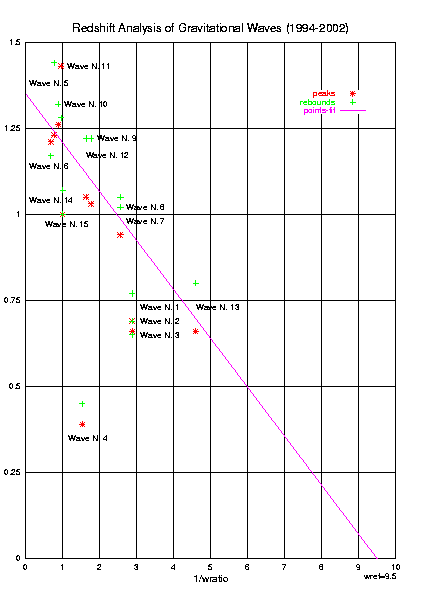
to Gravitational Waves. Part 7: Redshift The preliminary redshift analysis of highly intensive gravitational waves performed
at the end of 2000 (see Appendix of Part 2) has been updated. The reasons are the following:
Part 6: The collapsing of Multiple Nucleus Quasars After the two collapses of high intensity happened in August 1999 and for about one year, a reduced number of gravitational waves investing the Earth and our Solar System. Part 5: More on the "Birth" and "Death" of Matter The "death" of old matter as well as the "birth" of new matter into the Universe are further investigated. Part 4: The detector "puzzle" After more than two years tests about the operating of the detector and checking the graphs produced by same, our conclusions about the detector behaviour indicate that it is
impossible to find any justification in the present Laws of Physics.
In other words, it is impossible to give a simple and satisfactory explanation of its behaviour, without rejecting some of the principles that form the basis of today's Physics. Part 3: "Birth" and "Death" of Matter The assembling of a LED sensor has allowed a further improvement of the time resolution,
allowing to record also events having a very small intensity and revealed by the presence of "notches"
overlapped on the main signal recorded by the detector. Part 2: Multiple Nucleus Quasars The analysis of the graphs carried out by the detector since 1994 up to now has allowed to discover a series of completely
new phenomena occurring in the Universe, among which, the existence of particular extra massive Multiple Nucleus Quasars (MNQs), that seem to affect its operating. Part 1: Description and operating of the detector The report describes a detector for Gravitational Waves conceived and built in 1994.
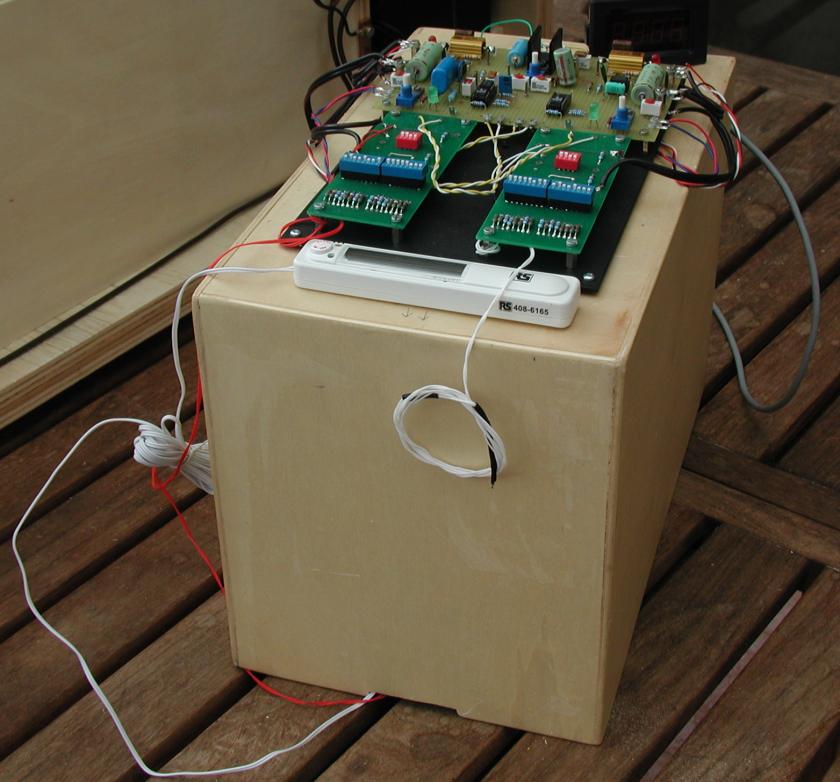
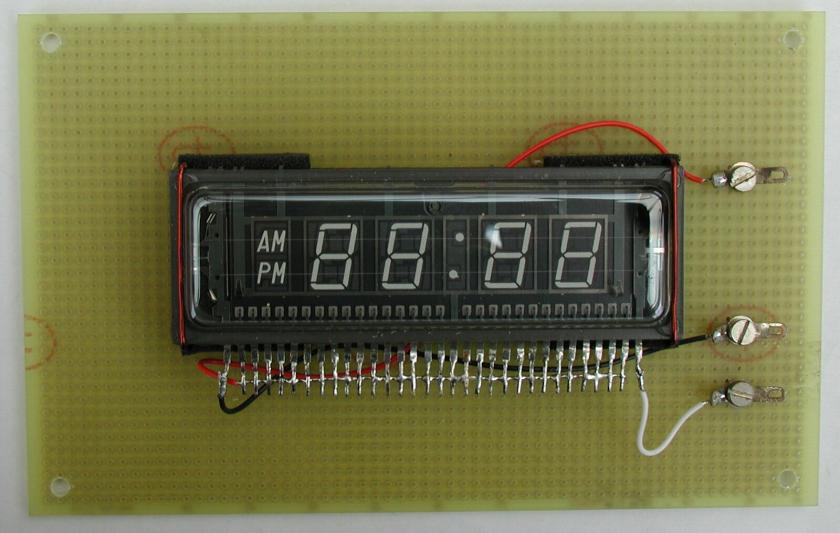
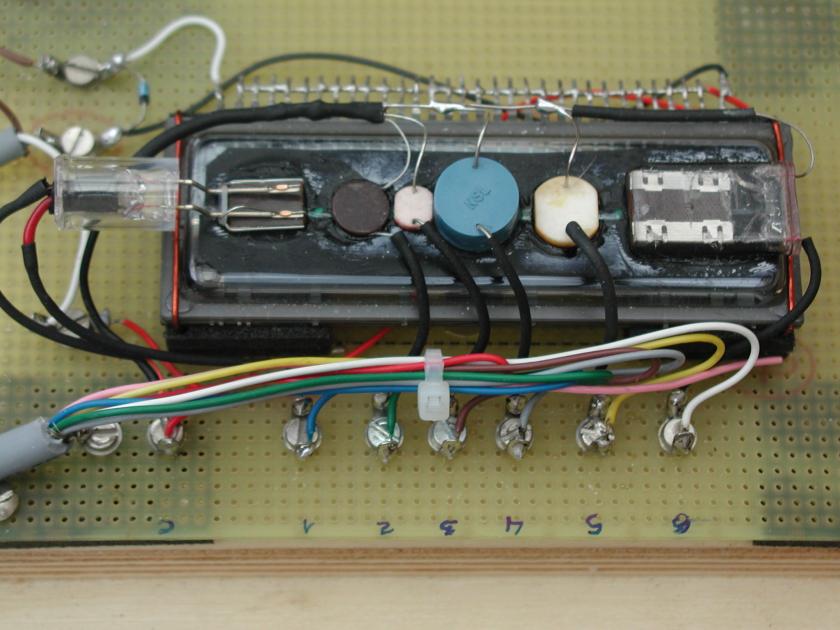
The behaviour of this simple instrument, which consists of Wheatstone bridge where in one of the two arms is located a
cadmium-sulphide photo-resistor (CdS) illuminated with a constant source of light emitted by a vacuum diode, was considered,
since the beginning, "anomalous".
The Detectors returned to proper operation after about 2 weeks (in October 20-22).
May, 2020 series of nuclei collapses: PNG image; PDF image.
Hires images: PNG image; PDF image.
February, 2017 nucleus collapse: PNG image; PDF image.
April, 2016 nucleus collapses: PNG image; PDF image
February, 2016 nucleus collapse: PNG image; PDF image
During the five days of black-out the data acquisition system (Agilent) has been turned off.
Because of the low ambient temperature during those days (about 15 degrees C) the internal thermostatic enclosure was not
capable to compensate the temperature for which the Detector 3 showed a significant lowering of the temperature
(about 5-6 degrees C).
On return of the power from the grid the external thermostatic enclosure went into service and the Detector 3 has
begun to function properly without losing the formatting. The Detector 2, instead, has completely lost its
formatting. It will be returned to service after making some improving changes.
A new series of collapses of nuclei has occurred since the end of January 2014 which led to the detector signal to rather
high values (typically in the month of March, the detector signal reaches its minimum value).
It will take some months of formatting to ensure that photoresistors can work again properly.
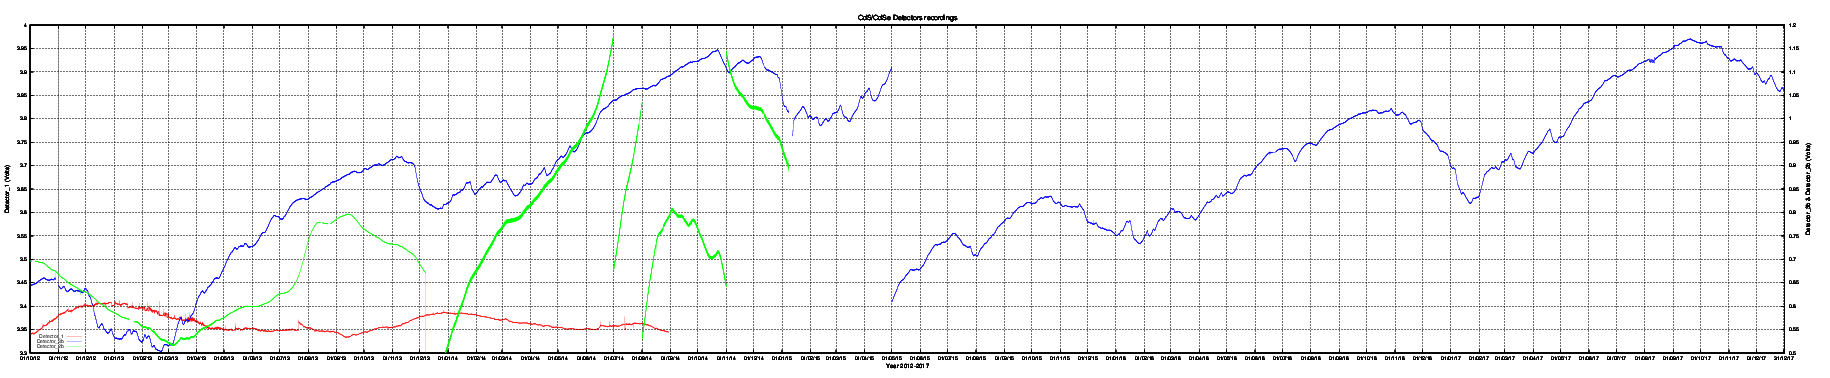
The Detector 3b is the one that best showed such an activity. The Detector 2b recorded, although to a lesser extent, the same activity,
while the Detector 1 after the accident occurred in July 2010 has stopped working properly.
The following graph compares, with greater detail, the records of the three detectors.
From 03 to 24 of July 2010 the external thermostatic enclosure of Detector_1 was not working properly due to very high
ambient temperatures.
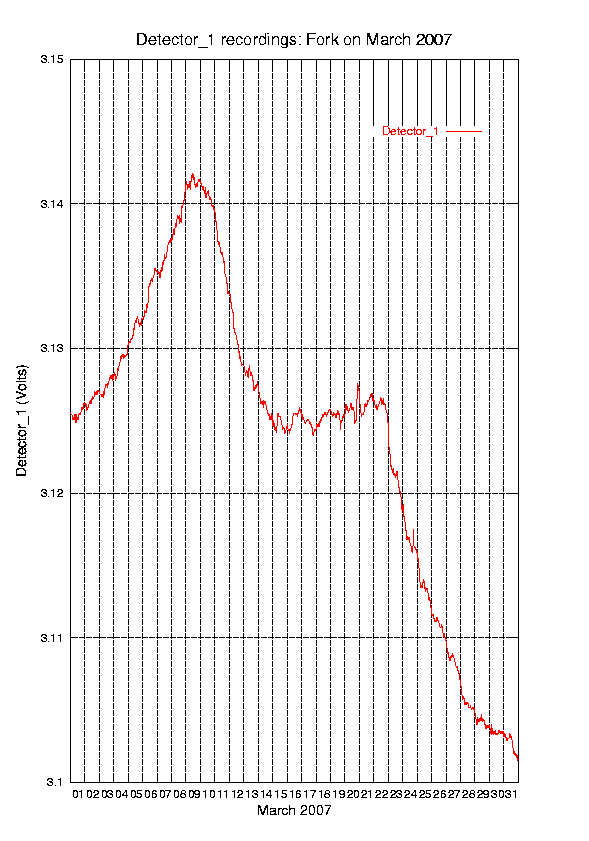
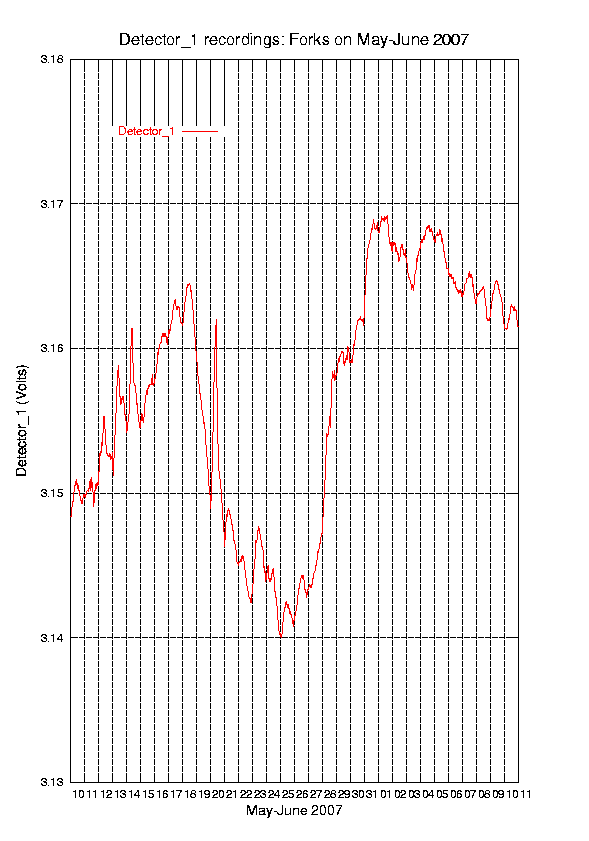
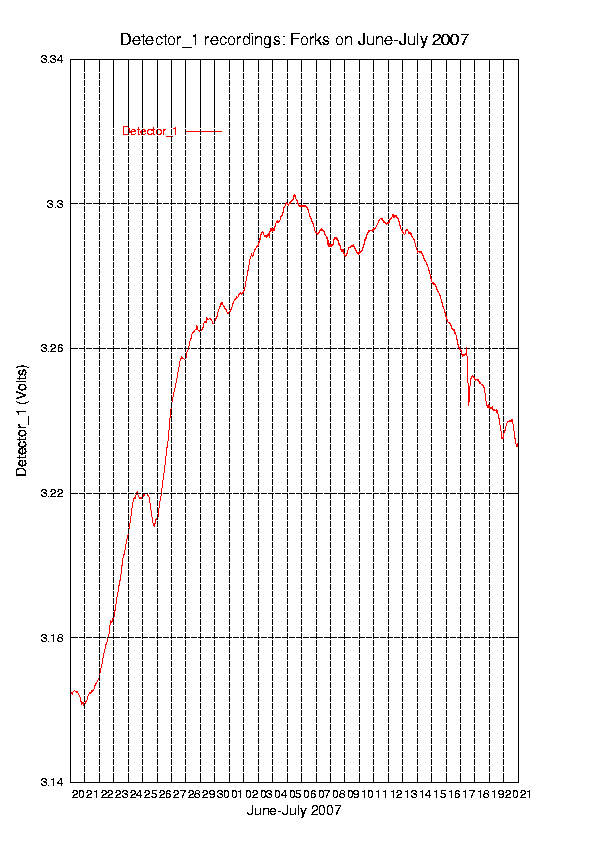
Starting with 2007 a new series of nucleus collapses belonging to the same Multiple Nucleus Quasar (MNQ) has been detecting.
The first one is quite well visible on March (a "fork" having the primary peak on 09 and the secondary peak on 22 of the month)
whose distance between peaks is approx. 12 days.
A second collapse having same characteristics was detected in the second half of May.
In June-July two more partially overlapped "forks" of the same kind were also detected, whose distance between peaks is still 12 days.
With a distance between peaks of 12 days, the width of wave is w=(12/11.5)*9.5=9.9 and redshift is z=w-1=8.9. The distance from us of
the MNQ results as:
r0=RU*z/(z+1)=RU*8.9/9.9, that is approx. 90 percent of visible Universe radius RU.
Nucleus collapse on July/August, 2006: PNG image
Unfortunately, due to a failure of the hard disk of Detector_3 computer we lost some (7 days) data on May.
r0=RU*z/(z+1)=RU*3.5/4.5, that is approx. 78 percent of visible Universe radius RU.
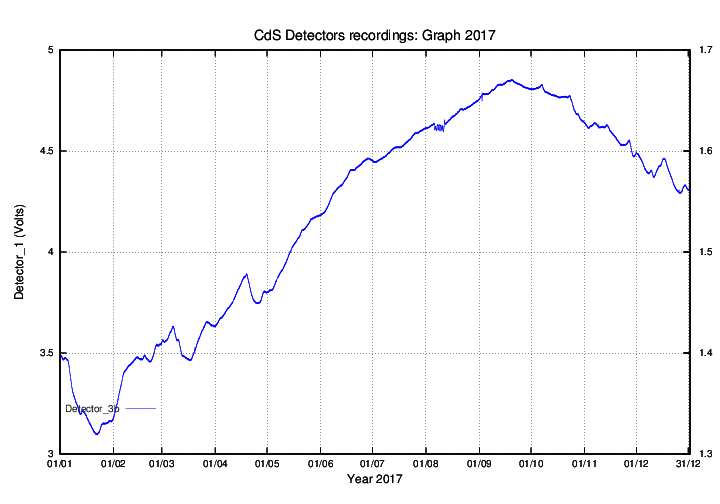
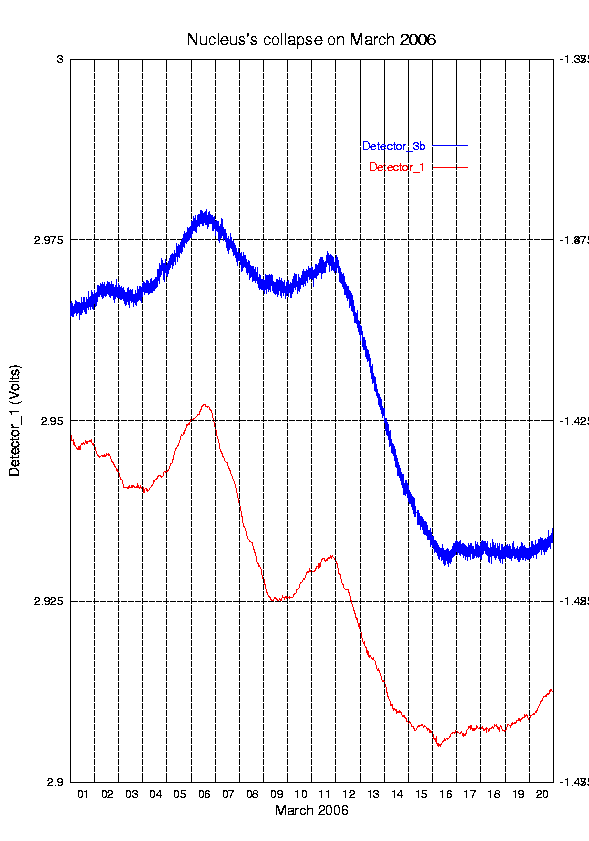
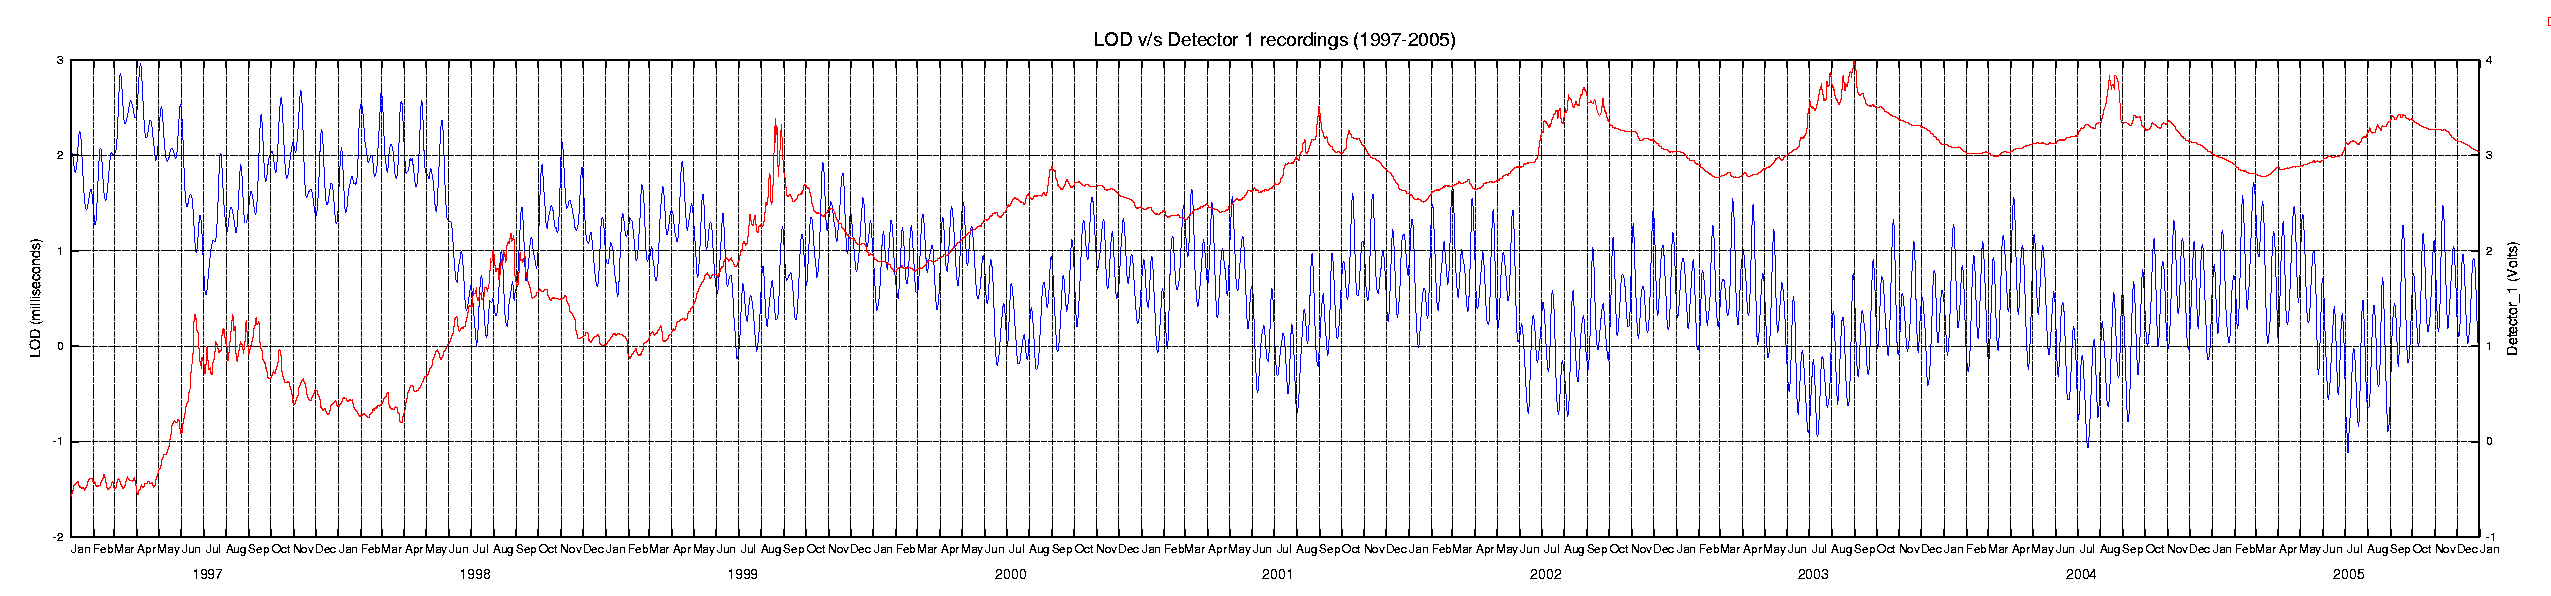
Unfortunately, in the first months of the year the sensitivity of detectors becomes lower because of the signal is over
helmed by an year-period standing gravitational wave, which has its minimum on 10-12 of March and its maximum on September
as it is shown in the whole graph. The amplitude of this wave is approx. 0.5 Volts.
This is due to a "flow" of space that continuously invest the Earth during its orbital motion about the Sun.
On September the Earth is going in the same direction of space while in in March in the opposite one.
In the meanwhile, the interaction between this "gravitational wind" and the Earth magnetic field becomes
the highest in June where the (relative) velocity variations have a maximum. A remarkable effect of this interaction
is the rapid slowing down Earth undergo during this month (approx. 2 milliseconds of reduction of the
Length-of-Day), as shown in the graph.
A quite similar effect seems to occur to the Sun in its 11-years period.
r0=RU*z/(z+1)=RU*7.3/8.3 approx. 88 % of visible Universe radius RU.
Unfortunately, on 28 June the Detector 3 temperature-controlled external enclosure failed.
The event disturbed a little the detector's operation (anode voltage variations of some mVolts).
During the external enclosure setting up, there were two more variations occurred on 19 and 22 July.
On 28 July it was definitely fixed.
A quite big "fork" with 8.5 days of distance between the peaks has been detected.
The redshift of this collapse is z= 6.0 and the distance from us, at the time of
collapsing, was 86 % of the visible Universe radius.
After more than one year of a "gravitational stillness", the effects produced by this wave can be noticeable quite well.
The impact of this gravitational wave with the Earth magnetic nucleus has caused many deep earthquakes, particularly during
the rise front of the wave and during the peaks where the changes of the slope of signal are higher.
Furthermore, many volcanos around the world have been re-activating. In the next weeks it will be more evident.
Because of the higher magnetic field, the interaction of this wave with the Sun was stronger.
In the next months (the Sun needs more time to show it) its effects will reach the surface and an increase of the number of sunspots,
flares, flux of energetic particles, etc... can be observed as well.
Please, note that the quite small ripple on Detector N. 3 data on 2 January 2004 is due to
the Wheatstone bridge zero-adjusting.
Rome, 28 February 2005
![]() PDF file (136 kb);
PDF file (136 kb); ![]() PDF file (141 kb)
PDF file (141 kb)
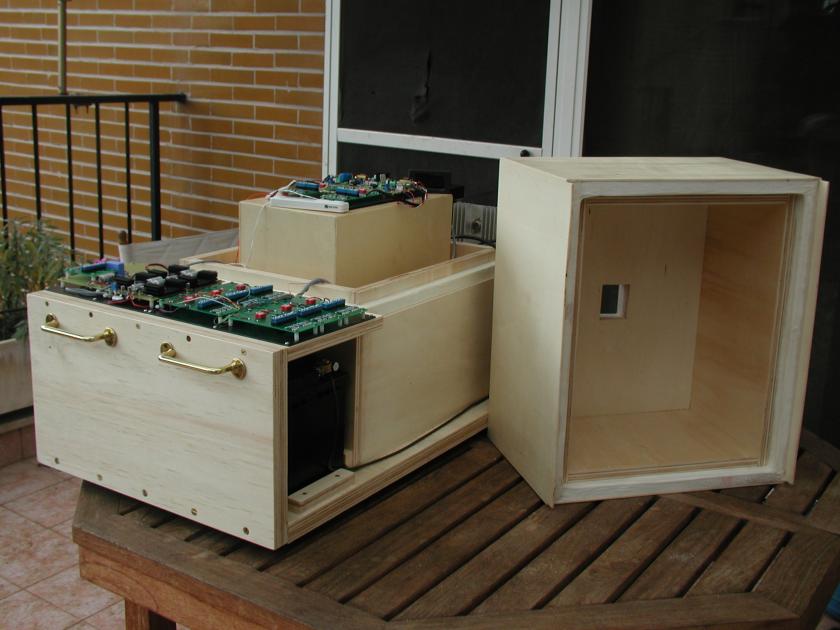
Detector_3 pictures and diagrams:
Rome, 31 March 2004
![]() PDF file (125 kb);
PDF file (125 kb); ![]() PDF file (124 kb)
PDF file (124 kb)
Selected waves: PDF file (245 kb)
Redshift graph: PNG image
Rome, 20 January 2003
Beginning from July 2001 a rather relevant "gravitational activity" has restarted. The analysis a single event concerning the general collapsing of a MNQ that happened at very long distance from us helped us to better understand these extraordinary phenomena continuously happening all over the Universe.
![]() PDF file (103 kb);
PDF file (103 kb); ![]() PDF file (102 kb)
PDF file (102 kb)
Rome, 28 February 2002
The set up a new Data Logger (Agilent 34970A) has allowed to start a new series of data acquisitions with an increased frequency of readings.
This increase of time resolution, has allowed to find out the exact shape of the "notches" and further reduce the uncertainty about the size of the nuclei of the MNQs at the moment of their "exit" from the Universe.
![]() PDF file (103 kb);
PDF file (103 kb); ![]() PDF file (202 kb)
PDF file (202 kb)
Rome, 31 August 2001
![]() PDF file (104 kb);
PDF file (104 kb); ![]() PDF file (106 kb)
PDF file (106 kb)
Rome, 31 August 2001
These lower intensity phenomena, as well as the discovery of MNQs, has led us to deeply revise the mechanisms showing how the Universe works and where the old matter "death" by the peculiar mechanism of cosmic collapses and new matter "birth" into the Universe.
A first attempt to lay down a preliminary balance of matter for the Universe is described, also if some points are still uncertain.
![]() PDF file (151 kb);
PDF file (151 kb); ![]() PDF file (151 kb)
PDF file (151 kb)
Fast recordings: 1, 2, 3, 4, 5
Most significant "notches", recorded since May 2001 until January 2002 (PDF files): Linux/Unix tar file (1780 kb); Windows zip file (1904 kb)
Rome, 15 February 2001
The analysis of a specific event recorded in summer 1995 allowed us to find the solution of the "redshift" problem related to these waves and, therefore, the distance from us of the events that have generated them.
The problem concerning the detector calibration, that is about the physical meaning of the voltage signal recorded by the detector, is also investigated.
![]() PDF file (225 kb);
PDF file (225 kb); ![]() PDF file (235 kb)
PDF file (235 kb)
Rome, 30 September 2000
The instrument is continuously operating since 26 April 1994 and graphs produced with the data recorded until 30 June 2000 are presented.
![]() PDF file (195 kb);
PDF file (195 kb); ![]() PDF file (202 kb)
PDF file (202 kb)
Graphs: A, B;
Pictures: 1, 2, 3